Fig. 6.
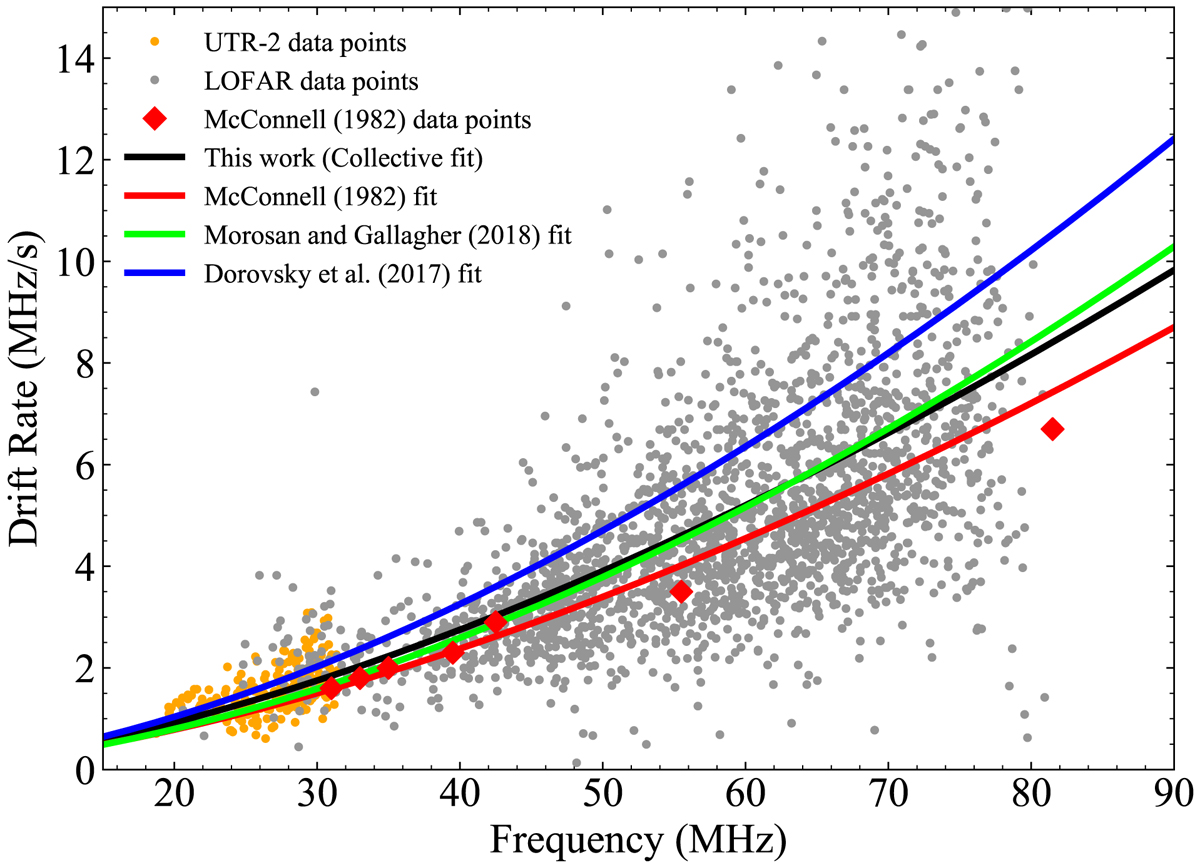
Dependence of drift rate on frequency fitted according to power laws using coefficients a and b. The fits derived from the observations of Morosan & Gallagher (2018), Dorovskyy et al. (2017), and McConnell (1982) are plotted in green, blue, and red, respectively. The black fit takes into account the orange (UTR-2 data), grey (LOFAR data from Morosan & Gallagher 2018), and red (data from McConnell 1982) points to provide, for the first time, a collective analysis of this dependence using multiple instruments.
Current usage metrics show cumulative count of Article Views (full-text article views including HTML views, PDF and ePub downloads, according to the available data) and Abstracts Views on Vision4Press platform.
Data correspond to usage on the plateform after 2015. The current usage metrics is available 48-96 hours after online publication and is updated daily on week days.
Initial download of the metrics may take a while.