Fig. 1.
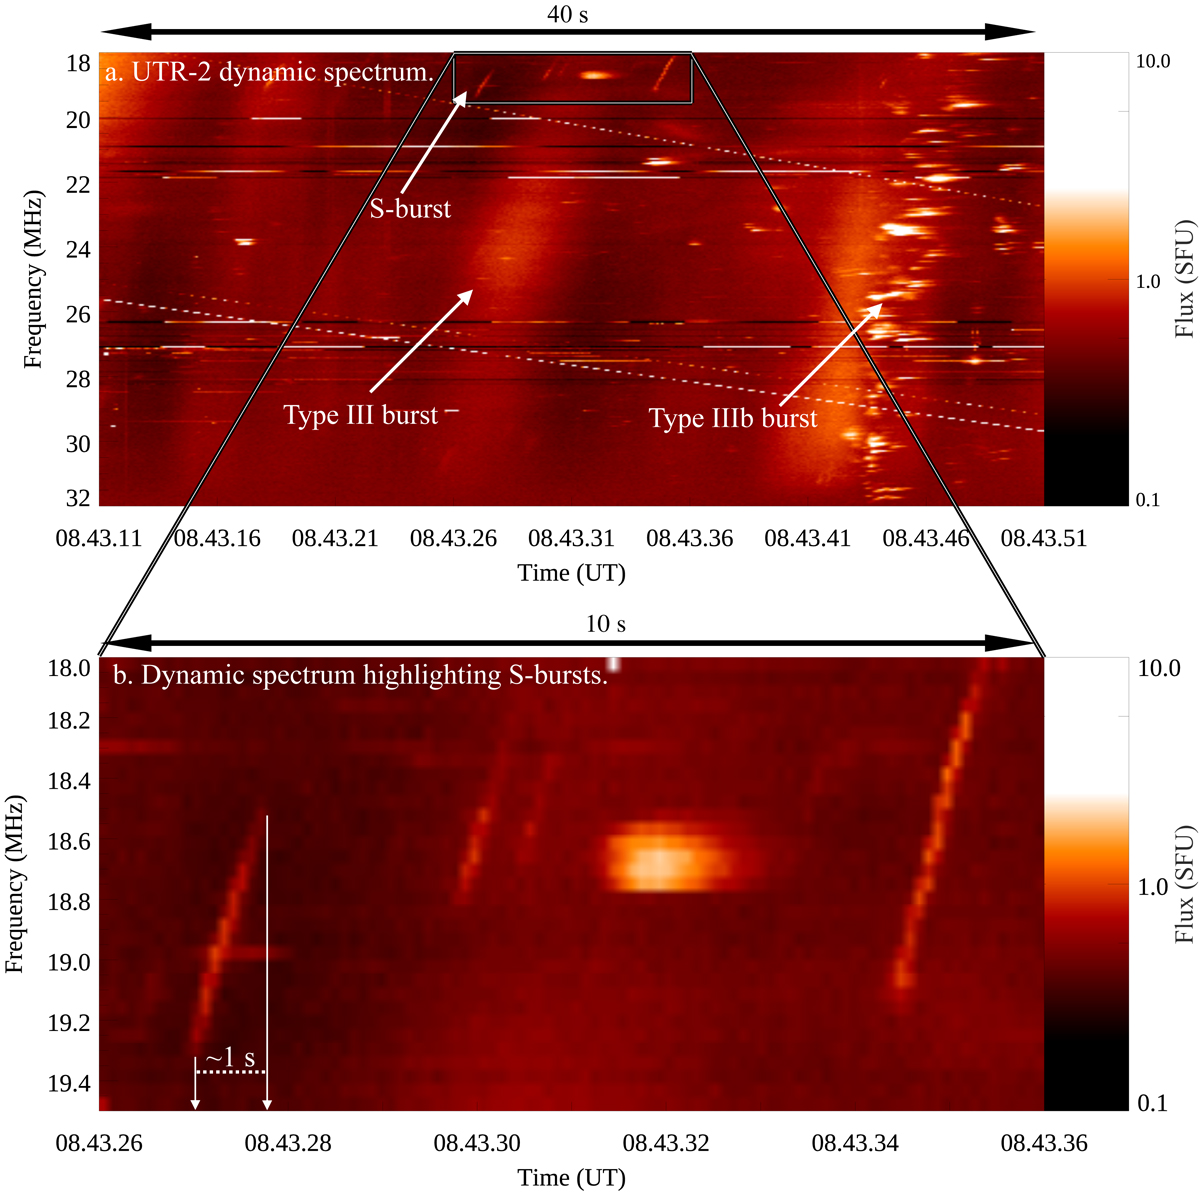
Panel a: dynamic spectrum obtained from UTR-2 on 9 July 2013 containing examples of type III, type IIIb, and S-bursts. Several negatively drifting S-bursts are shown within the highlighted region between the times of 08:43:26 UT and 08:43:36 UT and the frequency range of 18–19.5 MHz. A type III burst is also visible in this time frame. A type IIIb burst is visible between the times of 08.43.41 UT and 08.43.46 UT. Panel b: the highlighted region is shown in greater detail, indicating the short duration of the bursts (<1 s). Colour bars indicate the flux values of the bursts in solar flux units.
Current usage metrics show cumulative count of Article Views (full-text article views including HTML views, PDF and ePub downloads, according to the available data) and Abstracts Views on Vision4Press platform.
Data correspond to usage on the plateform after 2015. The current usage metrics is available 48-96 hours after online publication and is updated daily on week days.
Initial download of the metrics may take a while.