Free Access
Fig. 7.
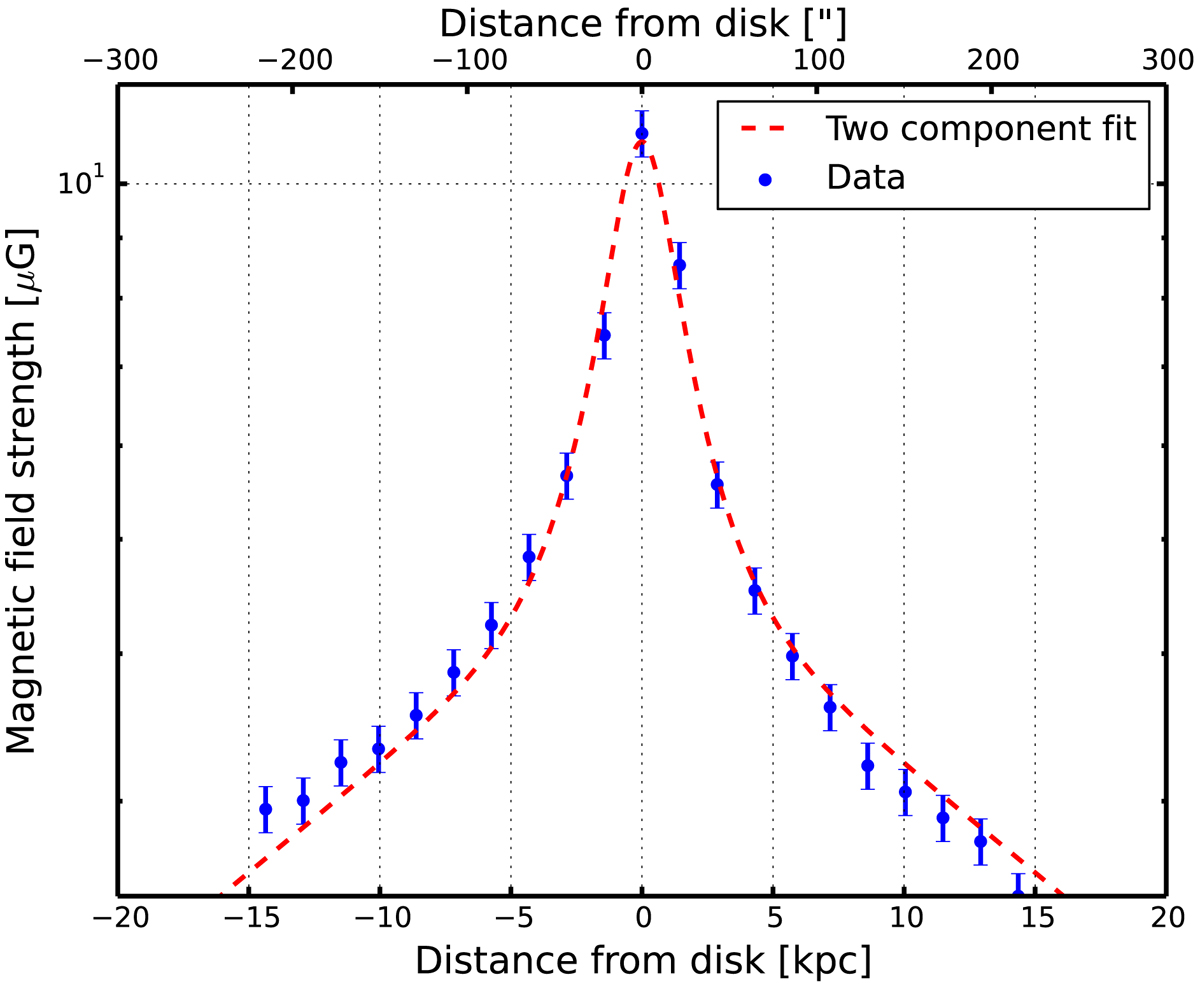
Profile of the magnetic field strength in NGC 3556 derived from the LOFAR 144 MHz map. The blue points represent measured data and the red dashed line the fit to the data.
Current usage metrics show cumulative count of Article Views (full-text article views including HTML views, PDF and ePub downloads, according to the available data) and Abstracts Views on Vision4Press platform.
Data correspond to usage on the plateform after 2015. The current usage metrics is available 48-96 hours after online publication and is updated daily on week days.
Initial download of the metrics may take a while.