Free Access
Fig. 3.
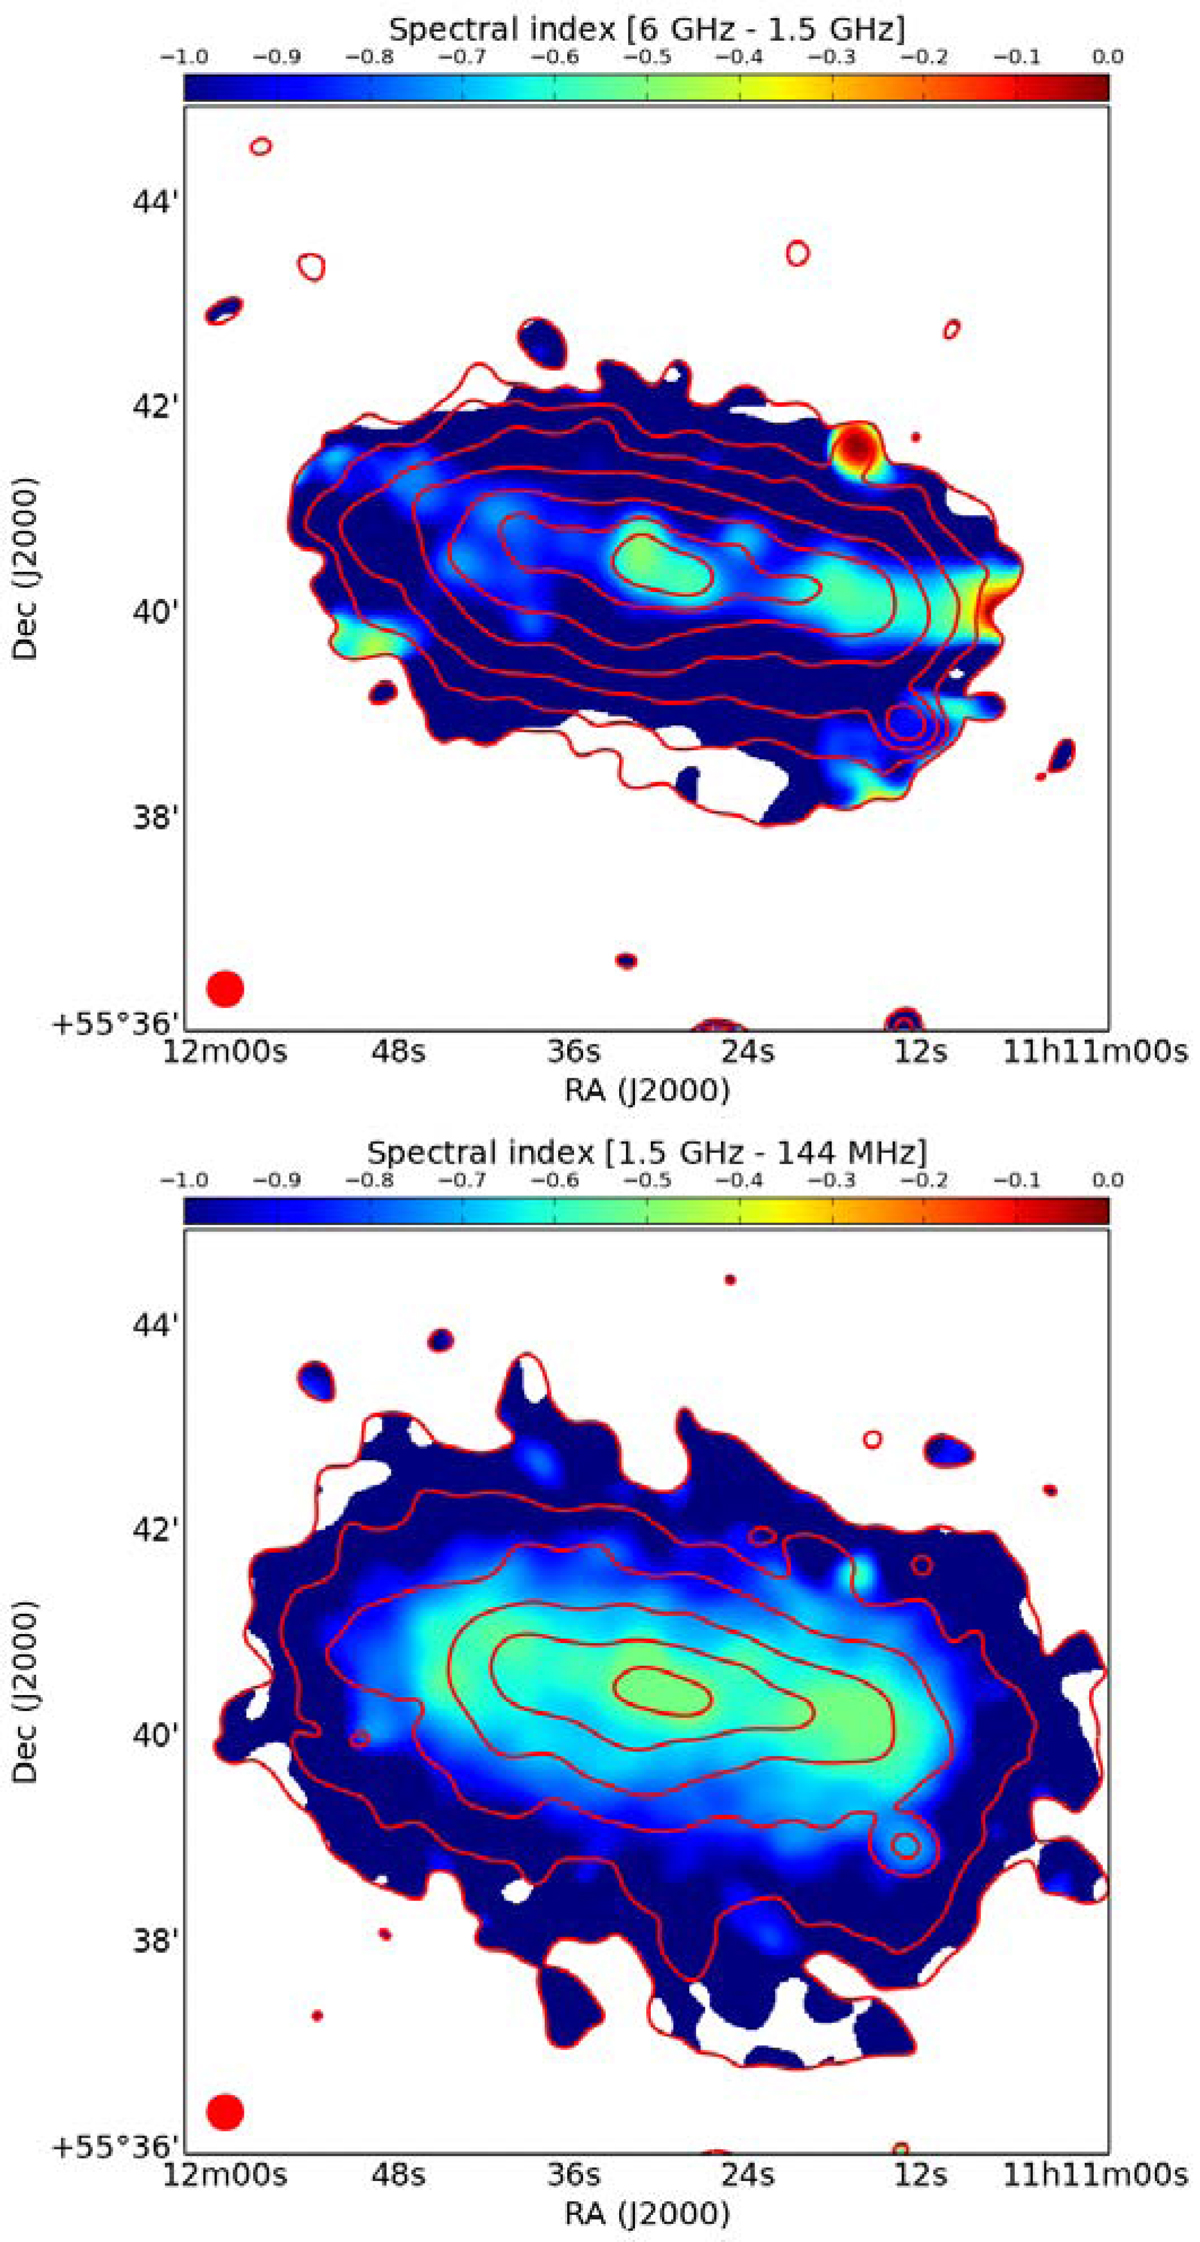
Radio spectral index maps. Top panel: from the CHANG-ES data calculated between 1.5 and 6 GHz. Bottom panel: between the 144 MHz LOFAR and the 1.5 GHz VLA maps. Red contours show the surface brightness distribution of the 1.5 GHz map (top) and 144 MHz map (bottom) with the same contour levels as in Fig. 1.
Current usage metrics show cumulative count of Article Views (full-text article views including HTML views, PDF and ePub downloads, according to the available data) and Abstracts Views on Vision4Press platform.
Data correspond to usage on the plateform after 2015. The current usage metrics is available 48-96 hours after online publication and is updated daily on week days.
Initial download of the metrics may take a while.