Fig. 12.
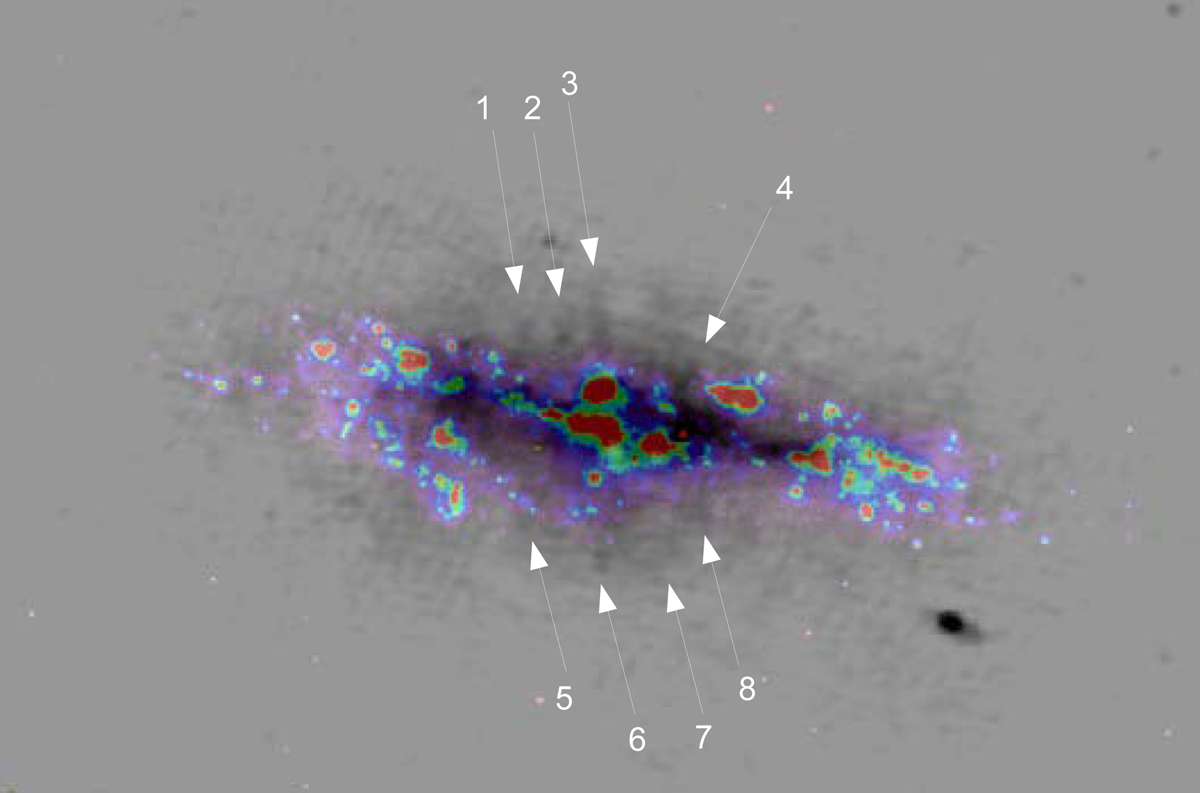
Sub-image measuring 9′ × 6′ of the high-resolution LoTSS tile containing NGC 3556 plotted as greyscale image; our continuum-subtracted Hα image is overlaid as a pseudo-colour image (intensity scale rainbow: from low intensity = violet and blue to high intensity = red). North is up, east is left in the image. Several radio structures are marked and numbered.
Current usage metrics show cumulative count of Article Views (full-text article views including HTML views, PDF and ePub downloads, according to the available data) and Abstracts Views on Vision4Press platform.
Data correspond to usage on the plateform after 2015. The current usage metrics is available 48-96 hours after online publication and is updated daily on week days.
Initial download of the metrics may take a while.