Fig. 9.
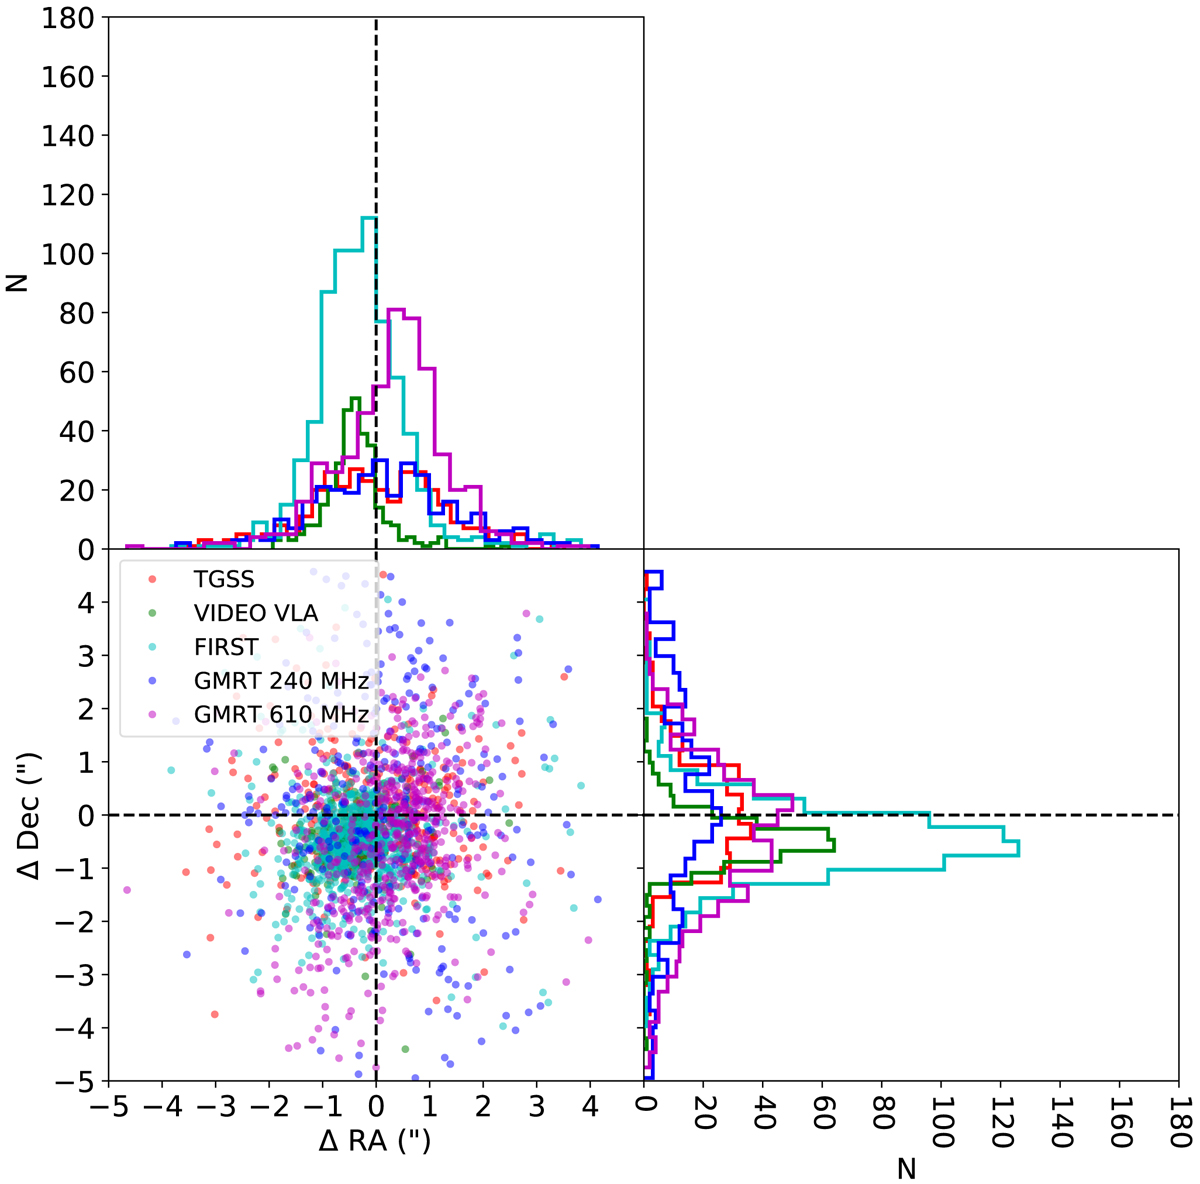
Positional RA and Dec offsets of the LOFAR sources compared to TGSS-ADR (Intema et al. 2017, red), VIDEO VLA observations (Heywood et al., in prep., green), FIRST (Becker et al. 1995; Helfand et al. 2015, cyan), and GMRT observations (Tasse et al. 2007) at 240 MHz (blue) and 610 MHz (magenta). The histograms are both modelled as a Gaussian and the median values are used to quantify the average offsets. The values of these are given in Table 6. For the histogram, the errors are calculated by the 16th and 84th percentiles.
Current usage metrics show cumulative count of Article Views (full-text article views including HTML views, PDF and ePub downloads, according to the available data) and Abstracts Views on Vision4Press platform.
Data correspond to usage on the plateform after 2015. The current usage metrics is available 48-96 hours after online publication and is updated daily on week days.
Initial download of the metrics may take a while.