Fig. 8.
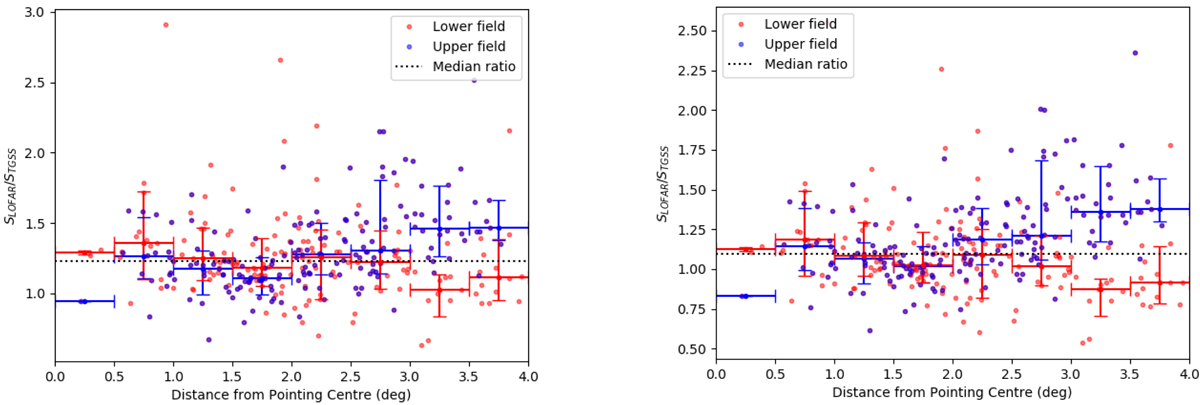
Comparisons of the integrated flux recorded by LOFAR and TGSS for sources matched within a 5″ radius as a function of distance from the pointing centre. Comparisons are shown, in the left-hand panel, from the TGSS-ADR catalogue from Intema et al. (2017) and, in the right-hand panel, from the rescaled TGSS-ADR catalogue from Hurley-Walker (2017). This shows the differences for the lower (red) and upper (blue) parts of the field, defined as split in declination at −4.5°. The black dotted line indicates the median ratio of LOFAR to TGSS-ADR fluxes across the whole field. Errors in distances from the pointing centre show the bin width, whereas those in flux ratios indicate the 16th and 84th percentiles in the flux ratios in that bin.
Current usage metrics show cumulative count of Article Views (full-text article views including HTML views, PDF and ePub downloads, according to the available data) and Abstracts Views on Vision4Press platform.
Data correspond to usage on the plateform after 2015. The current usage metrics is available 48-96 hours after online publication and is updated daily on week days.
Initial download of the metrics may take a while.