Fig. 7.
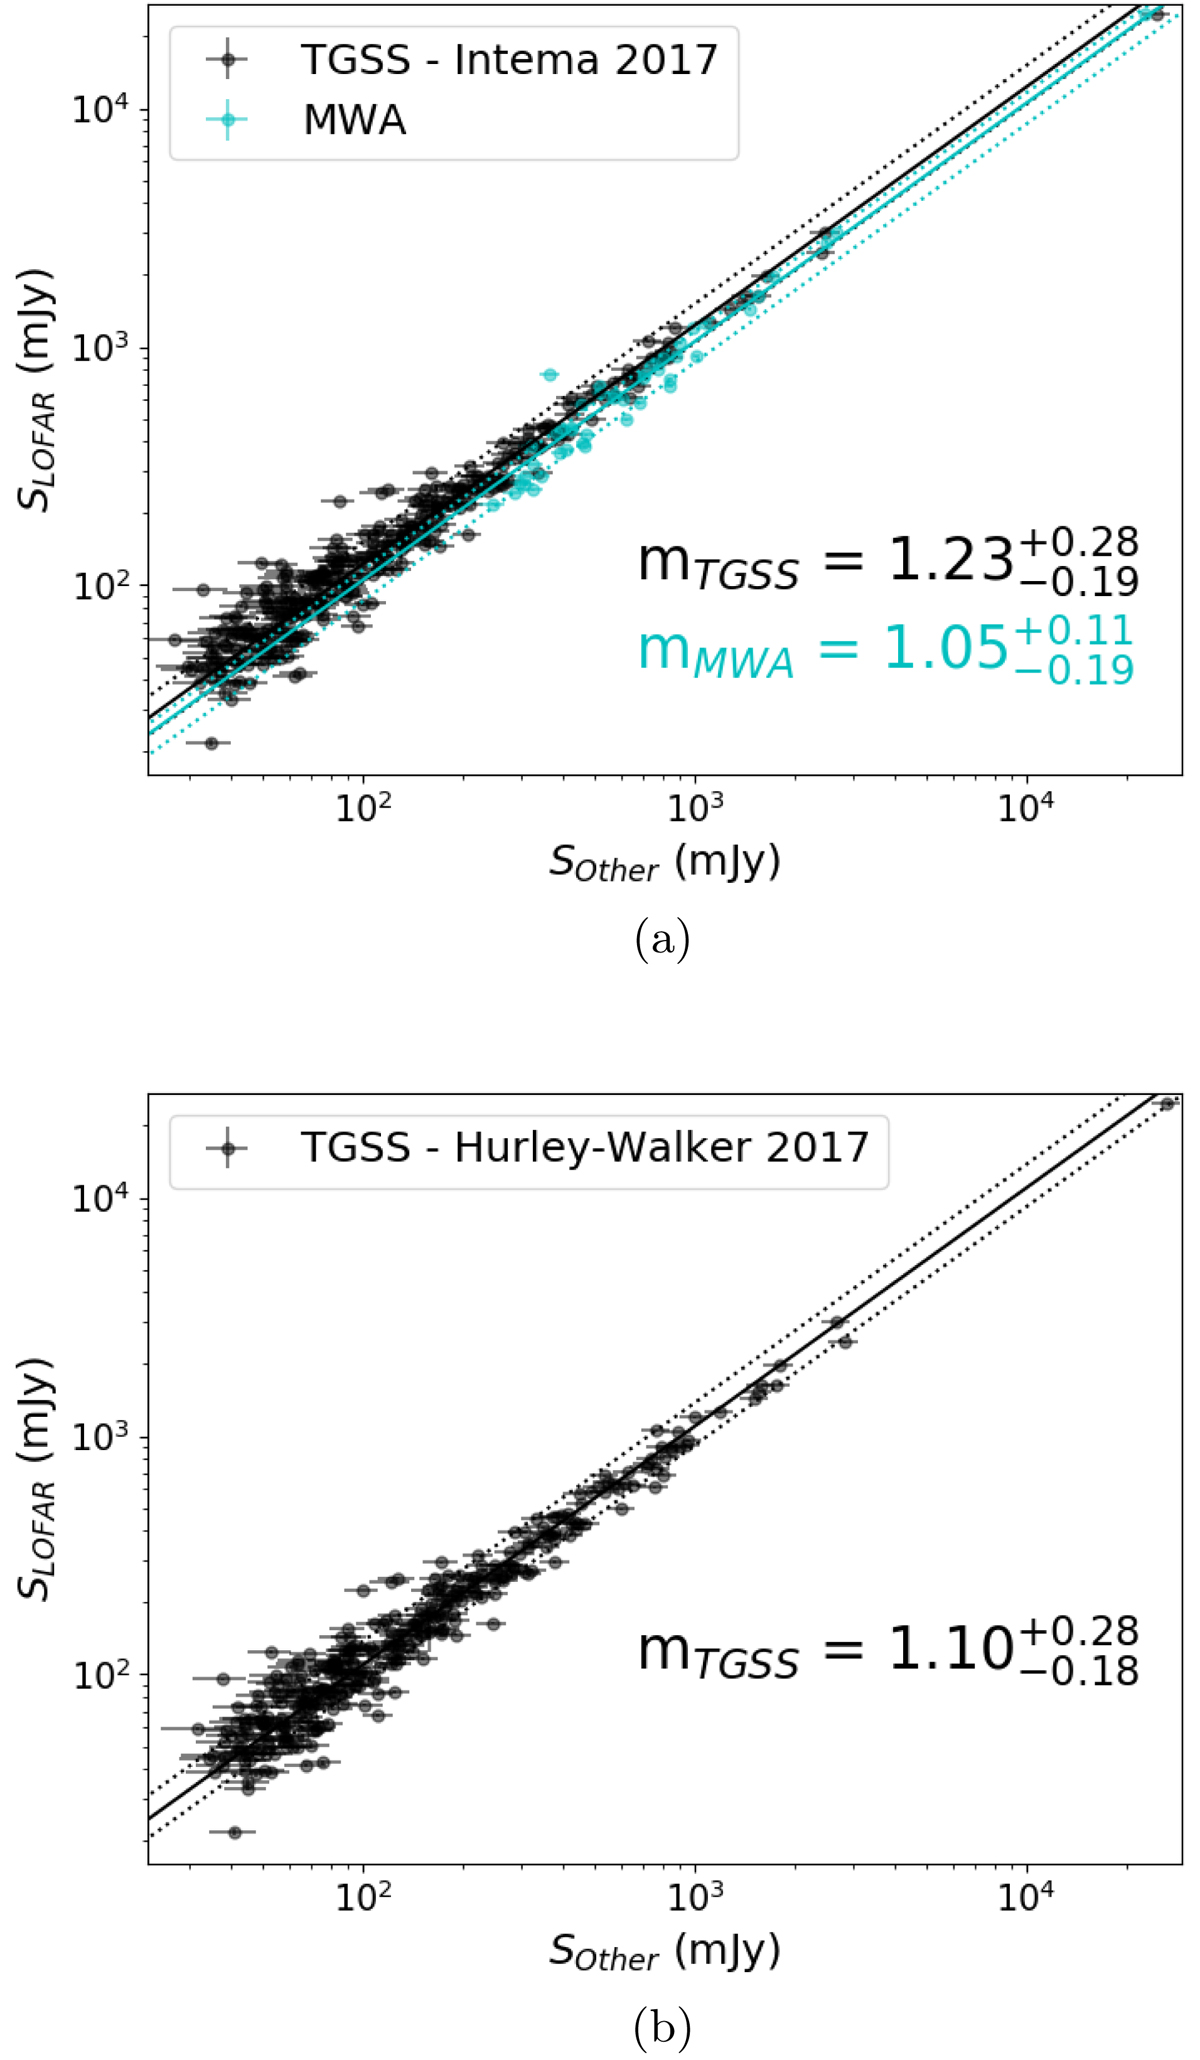
Comparisons of the integrated flux recorded by LOFAR to that recorded by TGSS-ADR (black) and MWA (cyan) in panel a and from the rescaled TGSS-ADR catalogue from Hurley-Walker (2017) in panel b. The black/cyan dotted lines show the fit to the data of the ratio between the two fluxes when the median offset of the ratio between LOFAR to TGSS-ADR/MWA is used. The dotted lines indicate the errors associated with these fits (generated using the 16th and 84th percentiles). We quote the value of the median SLOFAR/STGSS and SLOFAR/SMWA values and their errors in the lower right corner.
Current usage metrics show cumulative count of Article Views (full-text article views including HTML views, PDF and ePub downloads, according to the available data) and Abstracts Views on Vision4Press platform.
Data correspond to usage on the plateform after 2015. The current usage metrics is available 48-96 hours after online publication and is updated daily on week days.
Initial download of the metrics may take a while.