Fig. 5.
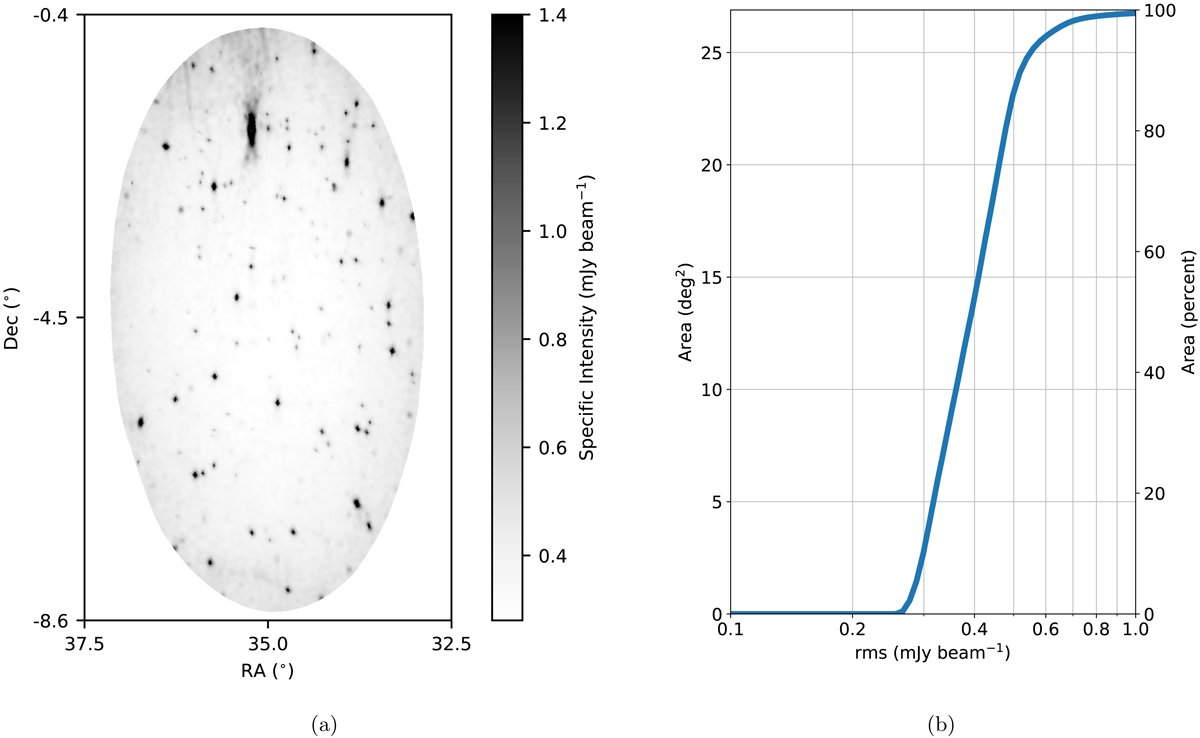
rms coverage of the LOFAR XMM-LSS images. Panel a: image of the rms coverage across the field in which the flux scale varies between σcen and 5σcen, where σcen is the central rms of the image that was found to be 0.28 mJy beam−1. Panel b: plot of the area of the field that has an rms less than the given value. On the left-hand y-axis this is as a function of area in deg2 and on the right-hand y-axis it is given as a percentage of the total area. The noise can be relatively high around bright sources in the field.
Current usage metrics show cumulative count of Article Views (full-text article views including HTML views, PDF and ePub downloads, according to the available data) and Abstracts Views on Vision4Press platform.
Data correspond to usage on the plateform after 2015. The current usage metrics is available 48-96 hours after online publication and is updated daily on week days.
Initial download of the metrics may take a while.