Fig. 13.
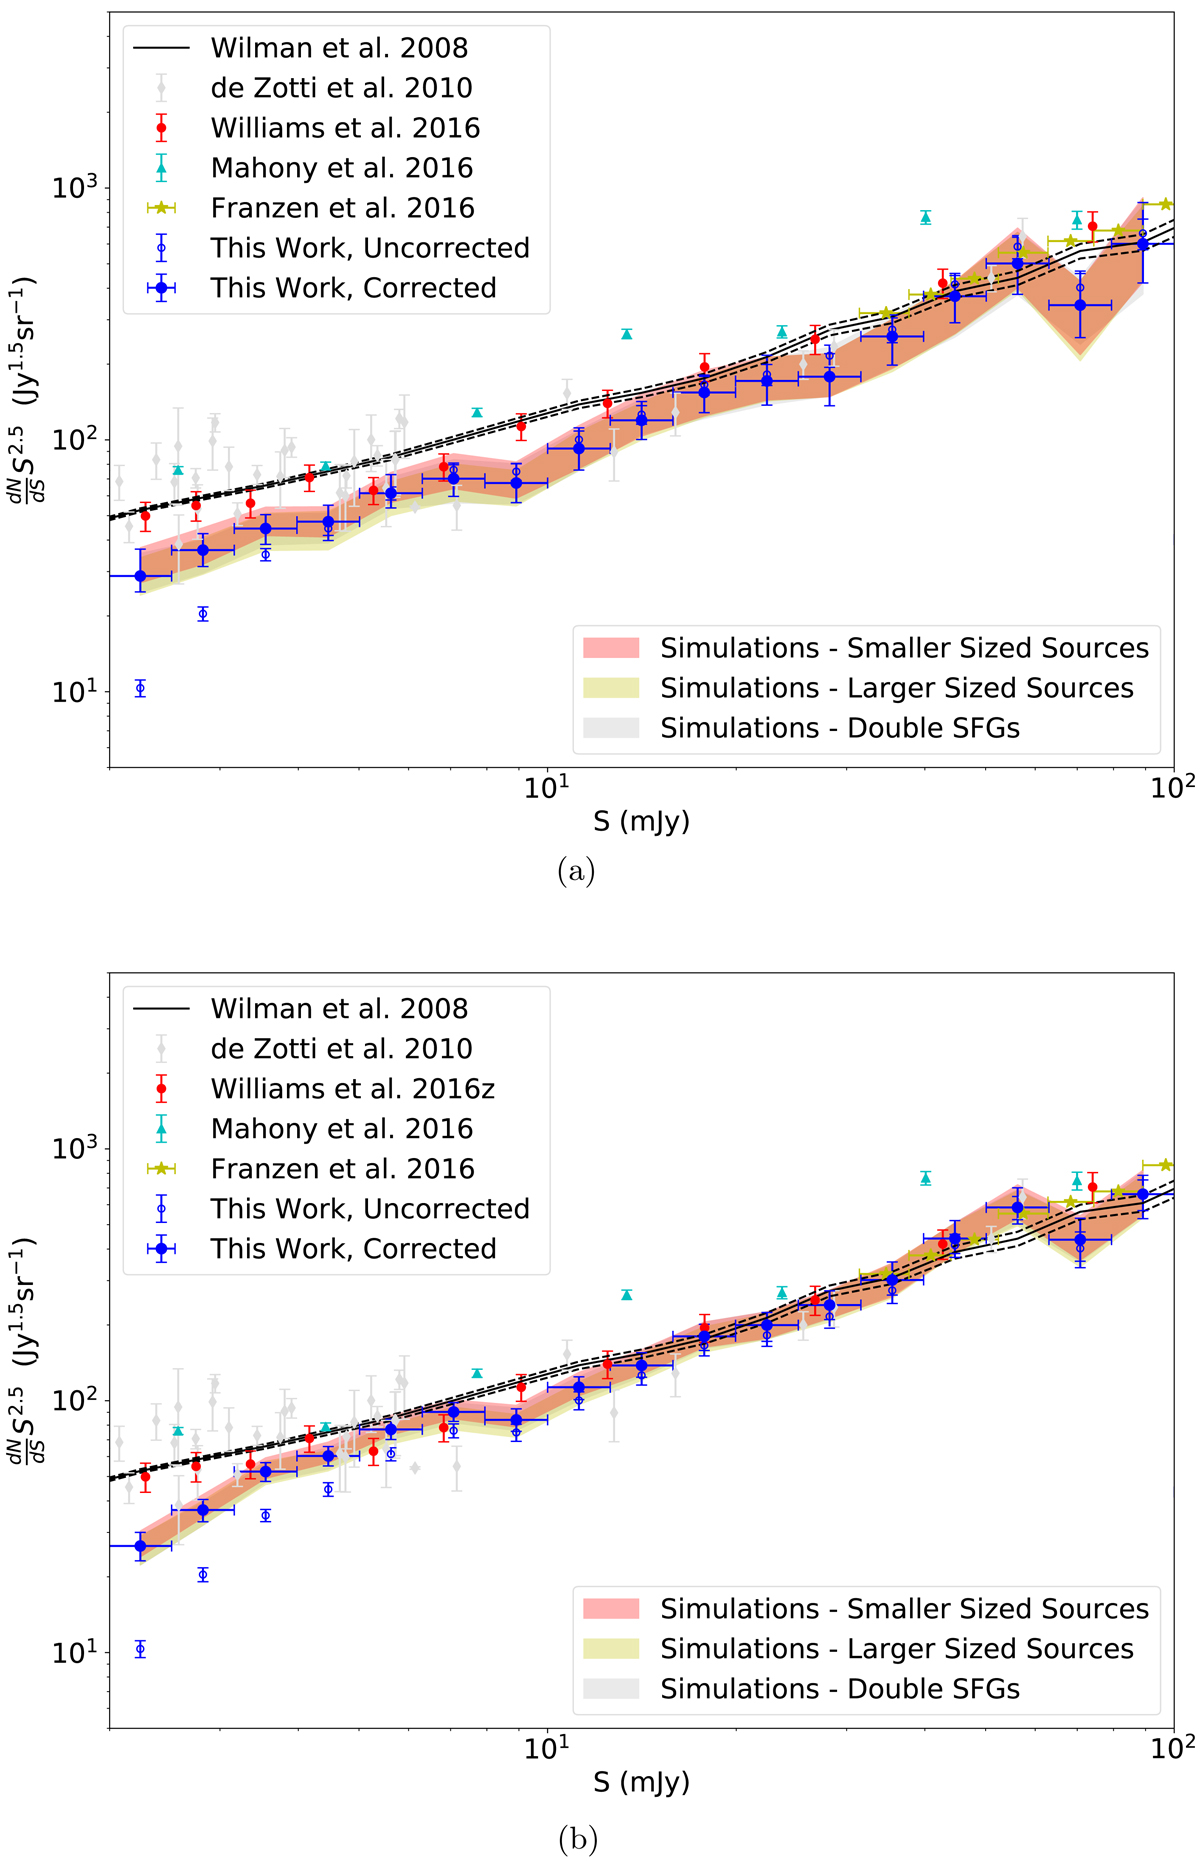
Measured and corrected source counts of the catalogue and comparisons to previous studies. Shown are the measured source counts (open blue circles); corrected source counts using the FDR and completeness simulations (filled blue circles); source counts from Franzen et al. (2016; yellow stars); source counts from Williams et al. (2016; red circles); source counts from de Zotti et al. (2010) scaled to ∼150 MHz assuming α = 0.7 (grey diamonds); source counts from Mahony et al. (2016; cyan diamonds), and finally simulated source counts from the S3 Wilman et al. (2008) simulations (red line). The shaded red and yellow regions reflect the source count corrections using smaller/larger sources from Sect. 6.4. The results using the Method 1 completeness correction are shown in panel a and those of Method 2 are shown in panel b.
Current usage metrics show cumulative count of Article Views (full-text article views including HTML views, PDF and ePub downloads, according to the available data) and Abstracts Views on Vision4Press platform.
Data correspond to usage on the plateform after 2015. The current usage metrics is available 48-96 hours after online publication and is updated daily on week days.
Initial download of the metrics may take a while.