Free Access
Fig. 11.
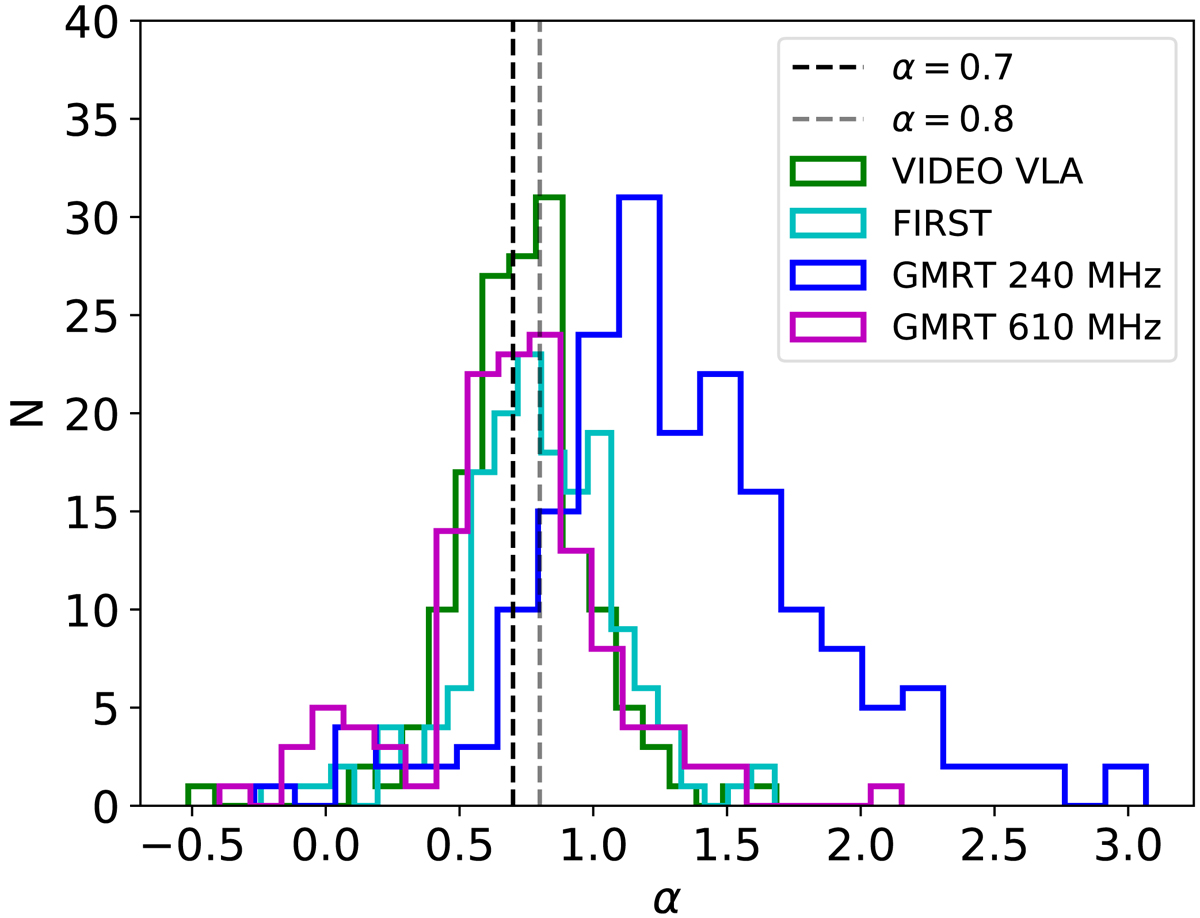
Histograms showing the measured spectral index, α, of sources in this field through matching to VIDEO VLA observations (Heywood et al., in prep., green), FIRST (Becker et al. 1995; Helfand et al. 2015, cyan), and GMRT observations (Tasse et al. 2007) at 240 MHz (blue) and 610 MHz (magenta) within a 5″ radius.
Current usage metrics show cumulative count of Article Views (full-text article views including HTML views, PDF and ePub downloads, according to the available data) and Abstracts Views on Vision4Press platform.
Data correspond to usage on the plateform after 2015. The current usage metrics is available 48-96 hours after online publication and is updated daily on week days.
Initial download of the metrics may take a while.