Fig. 1.
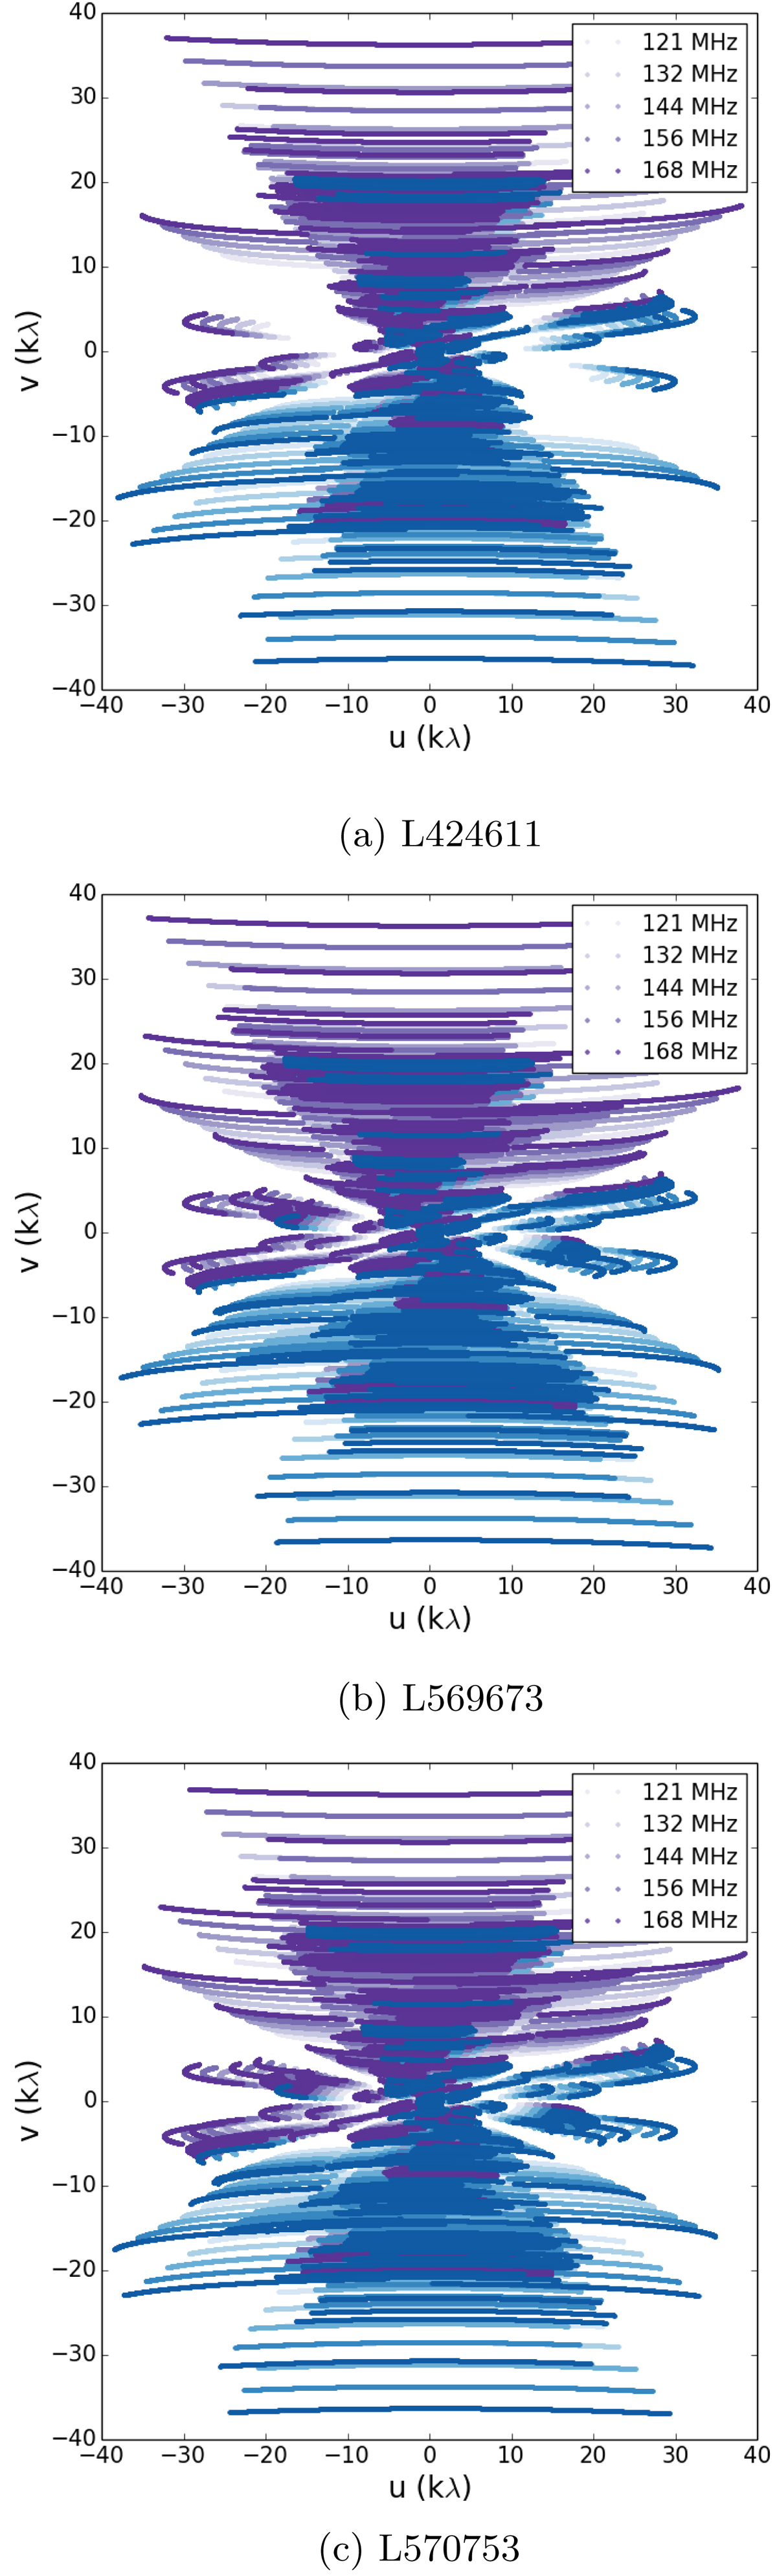
uv coverage of the data in kλ for the three observations. Panel a is for observation of L424611, panel b for L569673, and panel c for L570753. The shades of purple represent five different frequency bands corresponding to those at 121 MHz (lightest), 132 MHz, 144 MHz, 156 MHz, and 168 MHz (darkest). The conjugate points are plotted in blue.
Current usage metrics show cumulative count of Article Views (full-text article views including HTML views, PDF and ePub downloads, according to the available data) and Abstracts Views on Vision4Press platform.
Data correspond to usage on the plateform after 2015. The current usage metrics is available 48-96 hours after online publication and is updated daily on week days.
Initial download of the metrics may take a while.