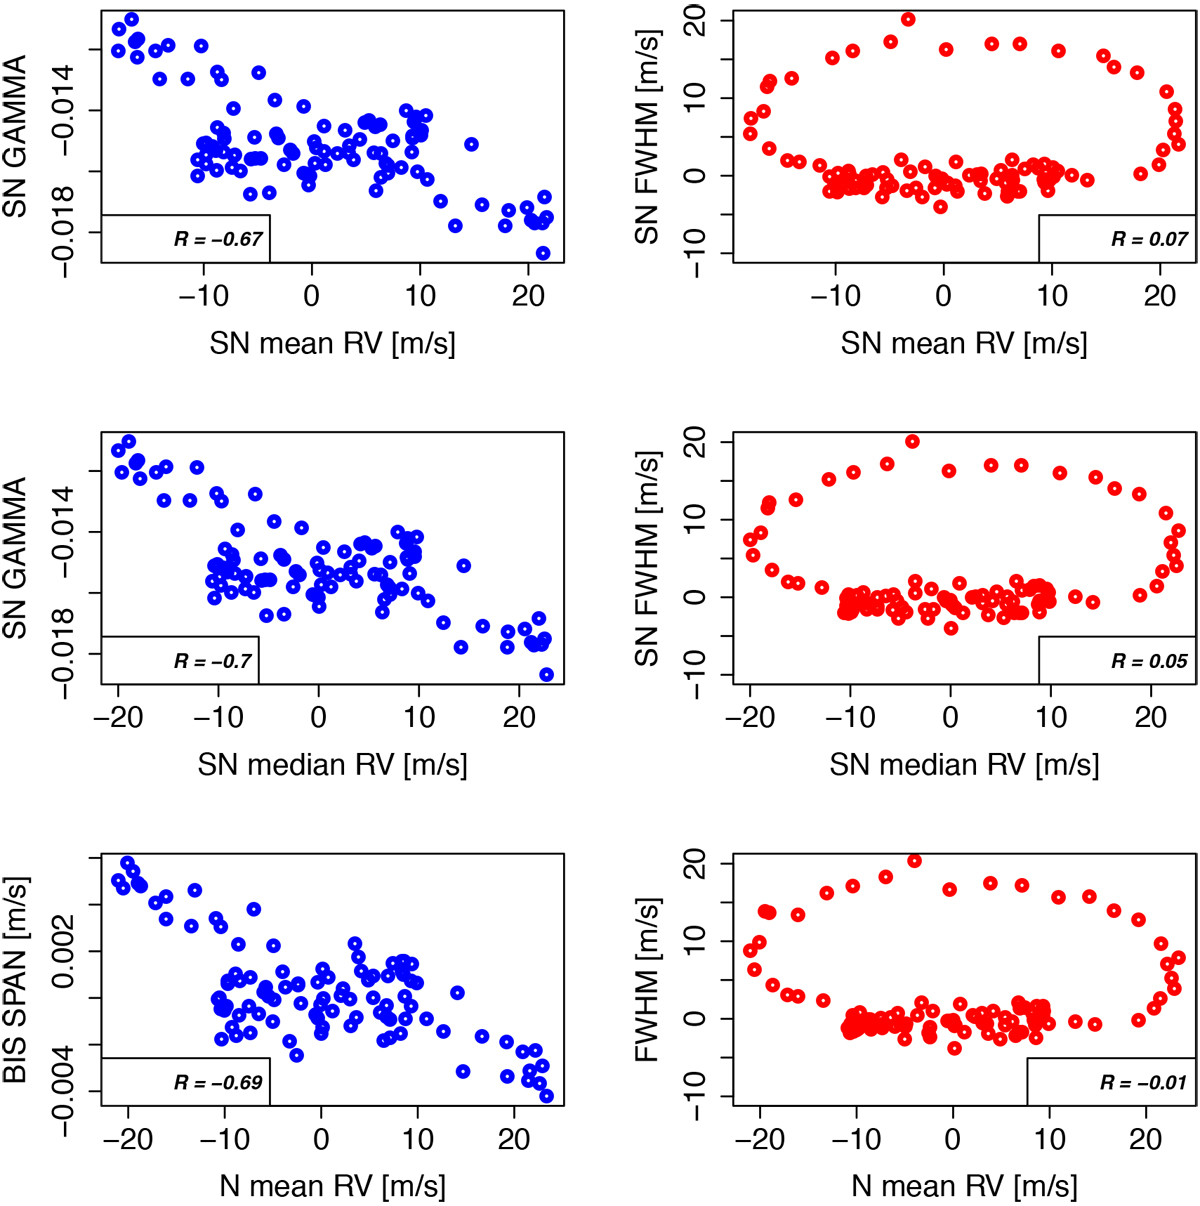
Fig. 9

Evaluation of the correlation between the RVs and the asymmetry parameters of the simulated data with a 1% spot and an injected planetary signal. The shape of the CCF changes as the spot moves, producing statistically significant correlations only between the estimated RVs and the asymmetry parameter. The correlations between the estimated RVs and the width parameter of the CCF are weaker than the case with only a spot.
Current usage metrics show cumulative count of Article Views (full-text article views including HTML views, PDF and ePub downloads, according to the available data) and Abstracts Views on Vision4Press platform.
Data correspond to usage on the plateform after 2015. The current usage metrics is available 48-96 hours after online publication and is updated daily on week days.
Initial download of the metrics may take a while.


