Fig. 8
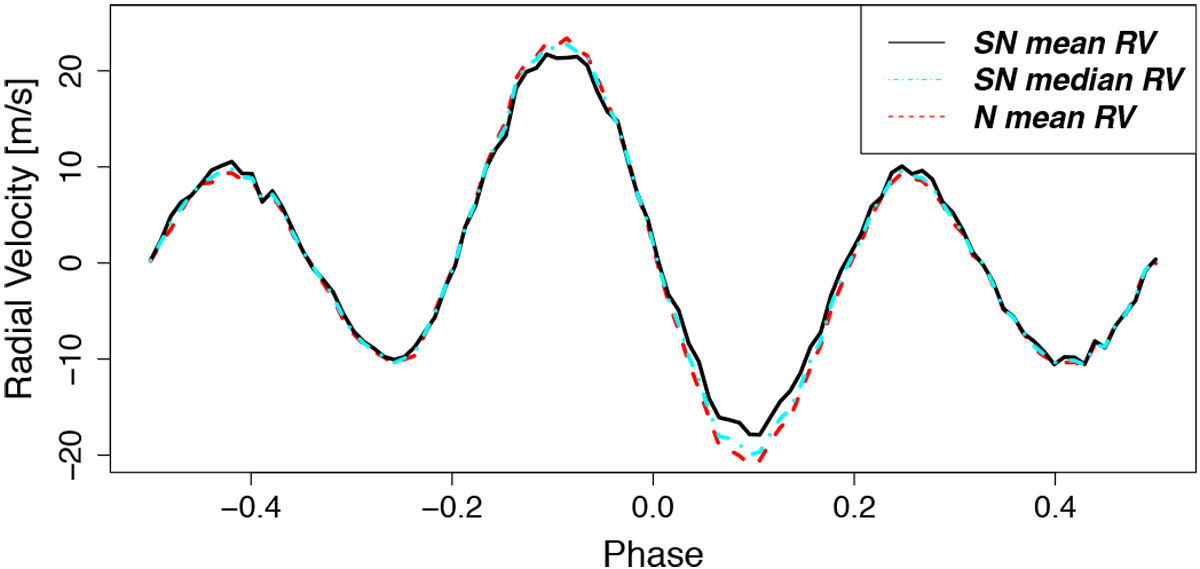
Radial velocity estimates for N mean RV (red dashed line), SN mean RV (black line), or SN median RV (cyan dot-dashed line). In this case, the CCFs have been generated using SOAP 2.0, considering an equatorial 1% spot on the simulated Sun in additionto a planet with a period of one-third of the rotational period of the star and an amplitude of 10 m s−1. The star does one full rotation between phase −0.5 and 0.5; the spot is seen face-on at phase 0.
Current usage metrics show cumulative count of Article Views (full-text article views including HTML views, PDF and ePub downloads, according to the available data) and Abstracts Views on Vision4Press platform.
Data correspond to usage on the plateform after 2015. The current usage metrics is available 48-96 hours after online publication and is updated daily on week days.
Initial download of the metrics may take a while.