Fig. 4
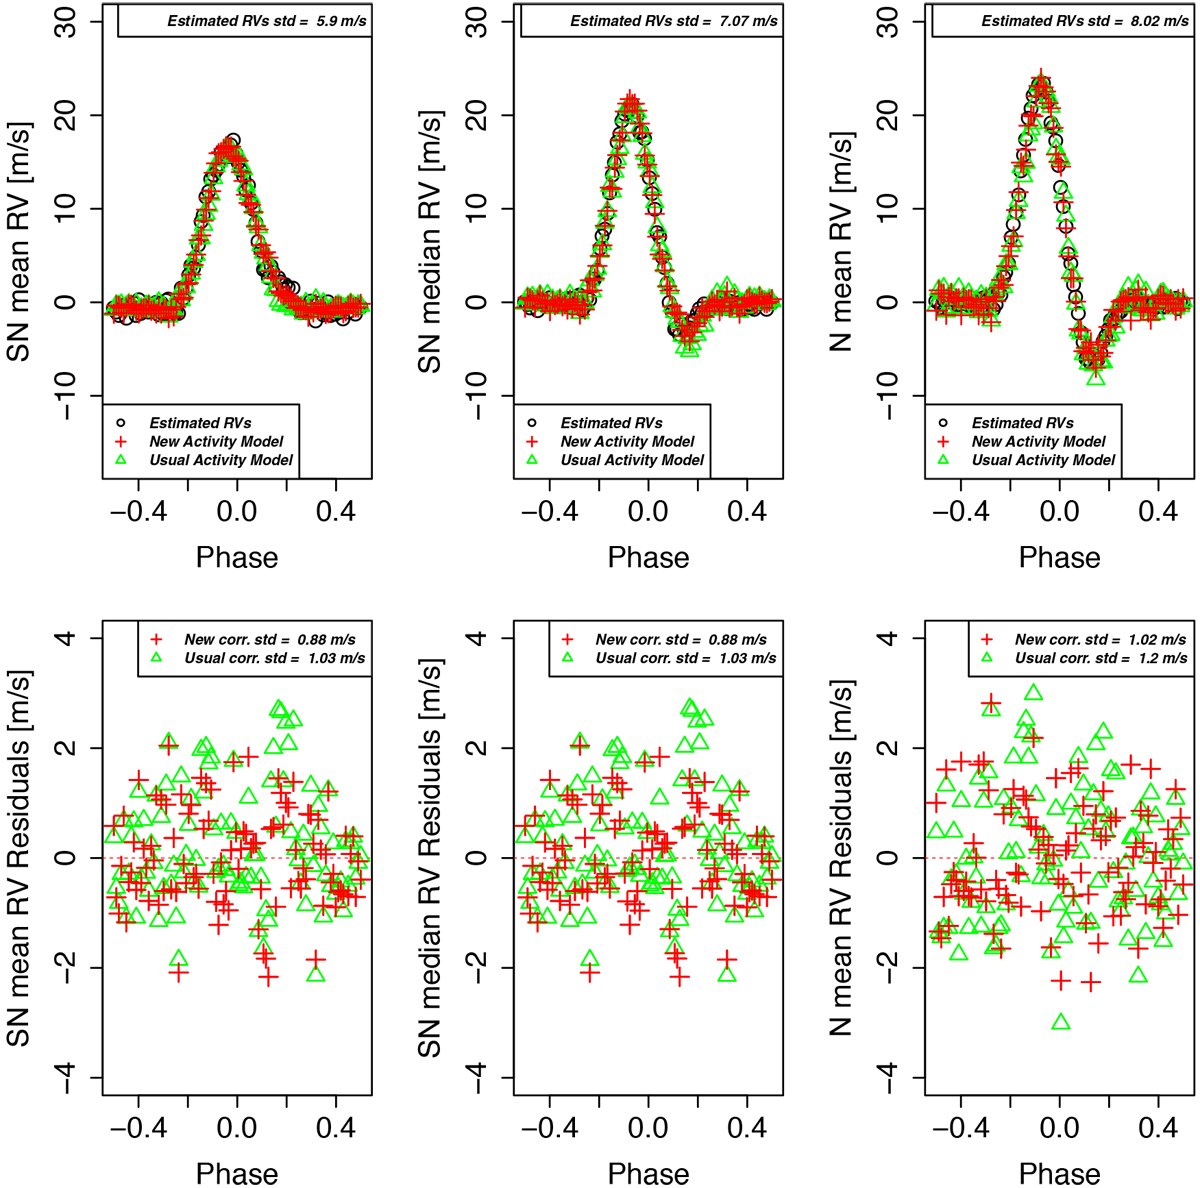
Top panels: spurious estimated RVs (black dots) caused by a facula in the simulated data using a Normal and a SN model, the estimated RVs using Eq. (5) (red pluses), and the estimated RVs using the usual correction for stellar activity (green triangles), based on RVactivity = β0 + β1γ + β2SN FWHM for the SN fitand on RVactivity = β0 + β1BIS SPAN + β2FWHM for the Normal fit. Bottom panels: residuals from the model fit using Eq. (5) (red pluses) and the residuals from the usual correction (green triangles). The standard deviations are also reported in the legend, and the residuals have a smaller systematic component when using the proposed model of Eq. (5) compared to the usual model. The tests of statistical significance on the parameters are presented in Table 2.
Current usage metrics show cumulative count of Article Views (full-text article views including HTML views, PDF and ePub downloads, according to the available data) and Abstracts Views on Vision4Press platform.
Data correspond to usage on the plateform after 2015. The current usage metrics is available 48-96 hours after online publication and is updated daily on week days.
Initial download of the metrics may take a while.