Fig. 2
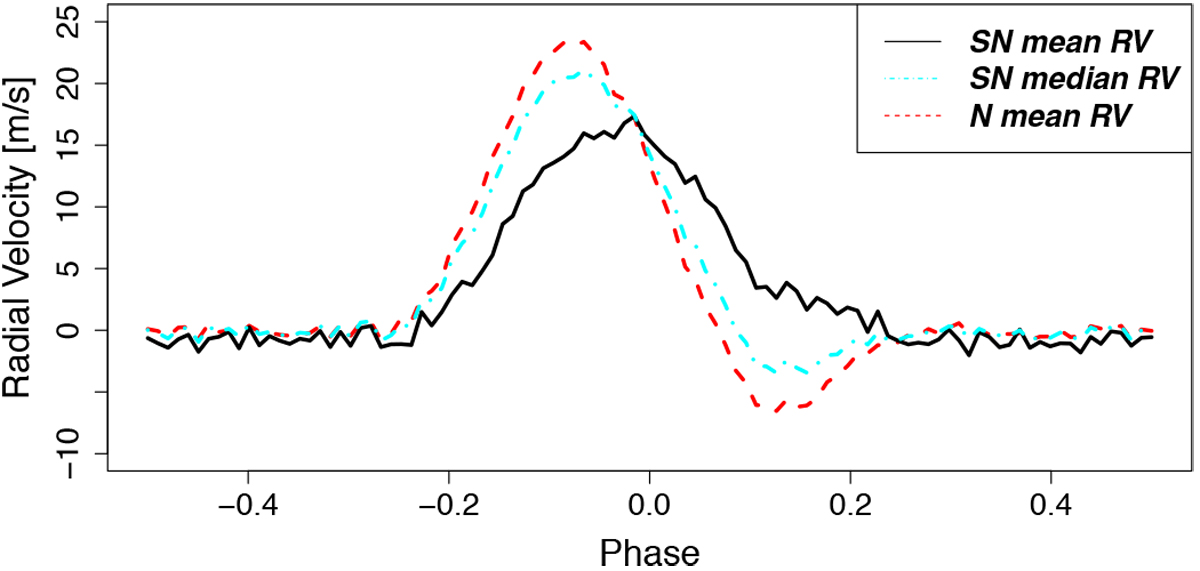
RV estimates for N mean RV (red dashed line), SN mean RV (black line), and SN median RV (cyan dotted-dashed line). In this case, the CCFs were generated using SOAP 2.0 with an equatorial3% facula on the simulated Sun. The star does one full rotation between phase −0.5 and 0.5; the facula are seen face-on for phase 0. The variations observed in SN mean RV are notably different from the variations measured in SN median RV and N mean RV.
Current usage metrics show cumulative count of Article Views (full-text article views including HTML views, PDF and ePub downloads, according to the available data) and Abstracts Views on Vision4Press platform.
Data correspond to usage on the plateform after 2015. The current usage metrics is available 48-96 hours after online publication and is updated daily on week days.
Initial download of the metrics may take a while.