Fig. A.5
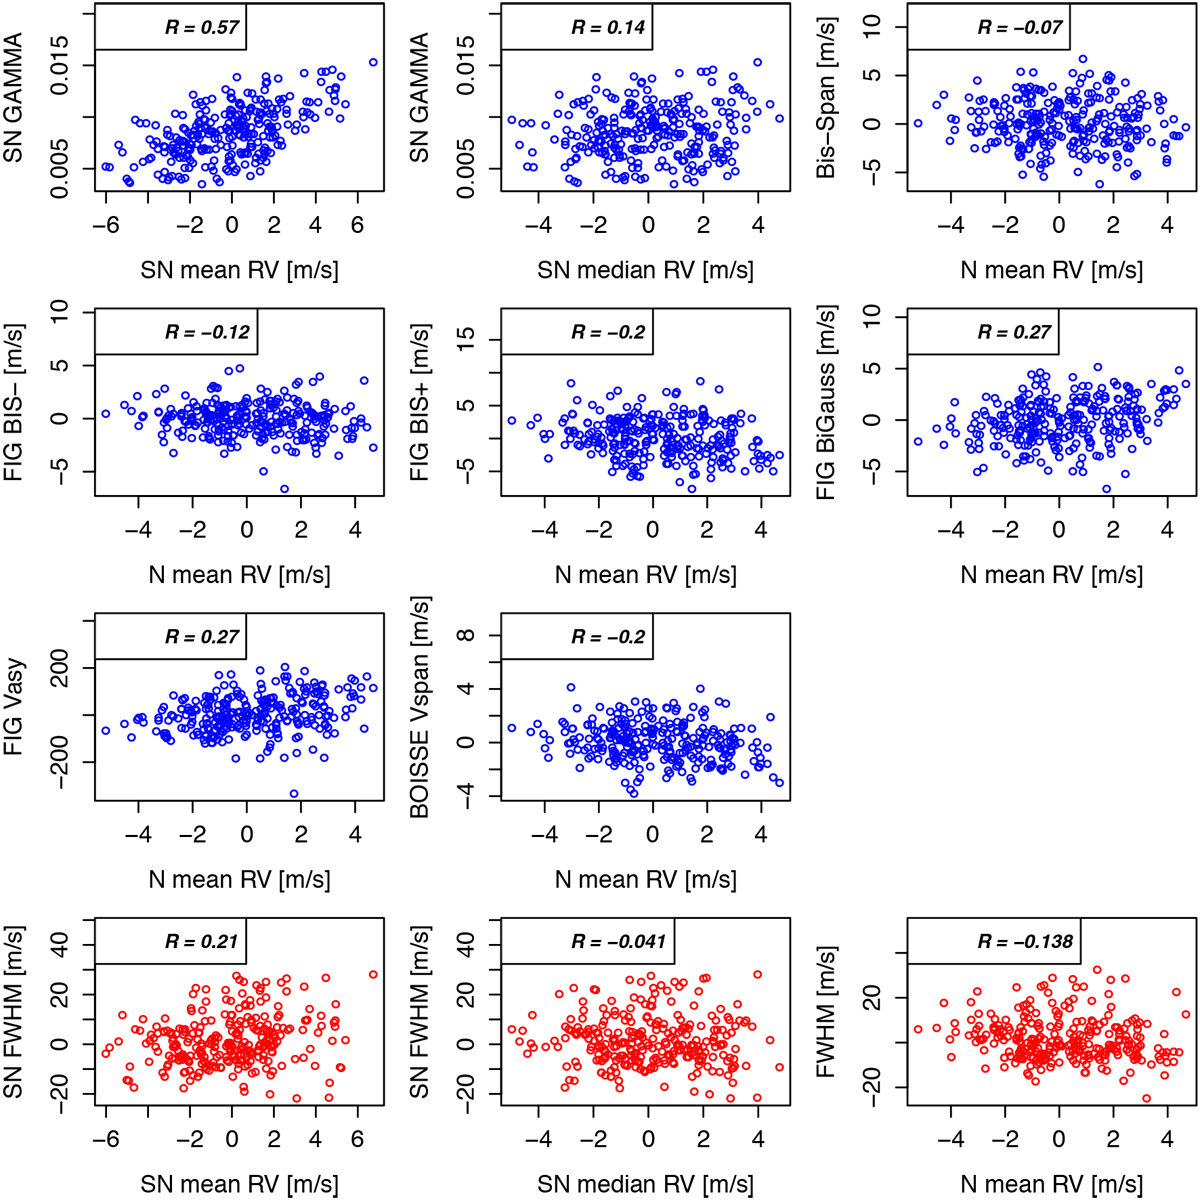
Top three rows: correlations between the asymmetry parameters and their corresponding RVs for HD 215152. Bottom row:correlations between the FWHM and the RVs for HD 215152. The correlations are consistently stronger when using SN mean RV compared to N mean RV. The p-values associated with each R are not statistically significant for the correlation between N mean RV and BIS SPAN (p-values = 0.27), the correlation between N mean RV and FIG BIS- (p-values = 0.05), the correlation between SN median RV and SN FWHM (p-values = 0.5), and the correlation between N mean RV and FWHM (p-values = 0.2).
Current usage metrics show cumulative count of Article Views (full-text article views including HTML views, PDF and ePub downloads, according to the available data) and Abstracts Views on Vision4Press platform.
Data correspond to usage on the plateform after 2015. The current usage metrics is available 48-96 hours after online publication and is updated daily on week days.
Initial download of the metrics may take a while.