Fig. A.2
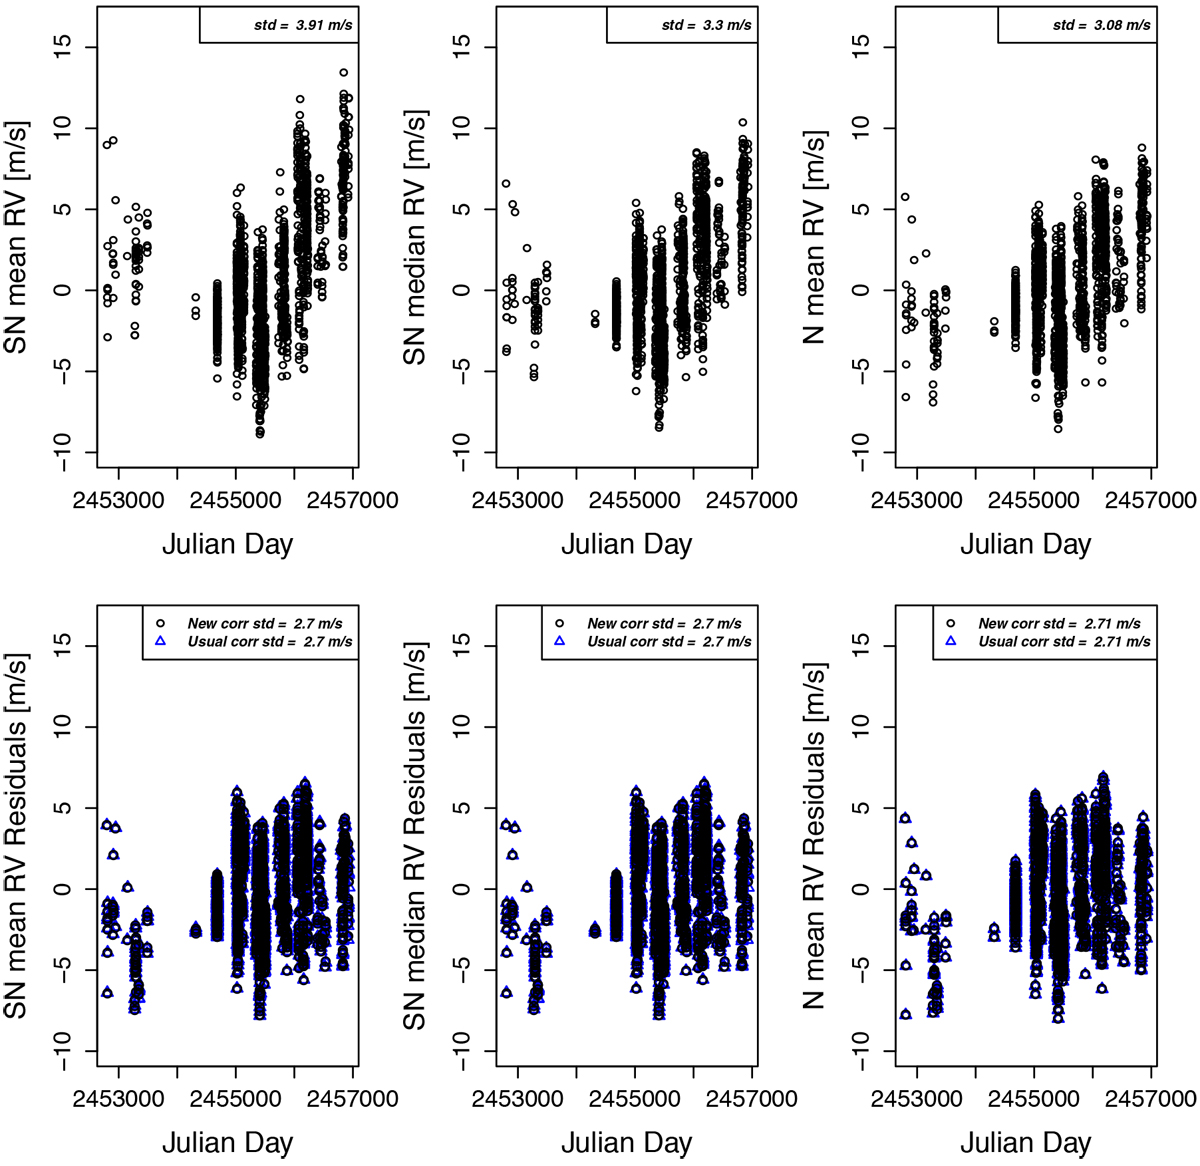
Toppanels: RVs (black dots) for HD 192310 estimated using a SN and a Normal fit. Bottom panels: residuals from the model fit using Eq. (5) (New corr. std–black dots) and the residuals from the usual correction (Usual corr. std–blue triangles), based on RVactivity = β0 + β1γ + β2SN FWHM for the SN fitand on RVactivity = β0 + β1BIS SPAN + β2FWHM for the Normal fit. The residuals for both the proposed correction from stellar activity are comparable.
Current usage metrics show cumulative count of Article Views (full-text article views including HTML views, PDF and ePub downloads, according to the available data) and Abstracts Views on Vision4Press platform.
Data correspond to usage on the plateform after 2015. The current usage metrics is available 48-96 hours after online publication and is updated daily on week days.
Initial download of the metrics may take a while.