Fig. 11
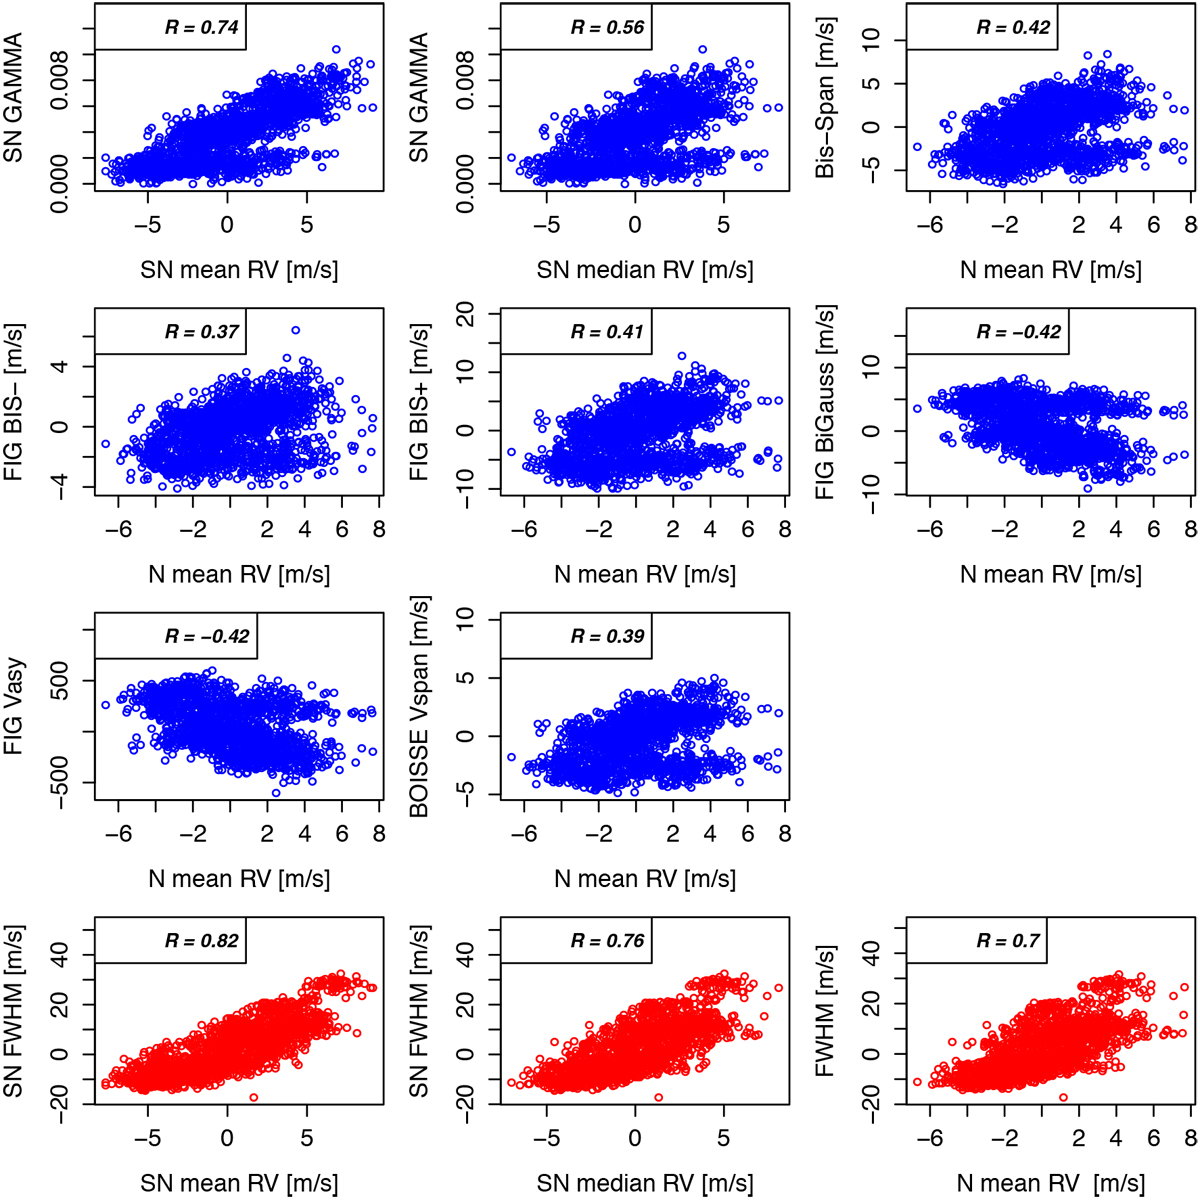
Topthree rows: correlations between the asymmetry parameters and their corresponding estimated RVs for Alpha Centauri B. Bottom row: correlation between the FWHM and the estimated RVs. The correlationsare stronger when using parameters derived from the SN fit than the Normal fit. The estimated R’s are all statistically significant.
Current usage metrics show cumulative count of Article Views (full-text article views including HTML views, PDF and ePub downloads, according to the available data) and Abstracts Views on Vision4Press platform.
Data correspond to usage on the plateform after 2015. The current usage metrics is available 48-96 hours after online publication and is updated daily on week days.
Initial download of the metrics may take a while.