Free Access
Fig. A.1.
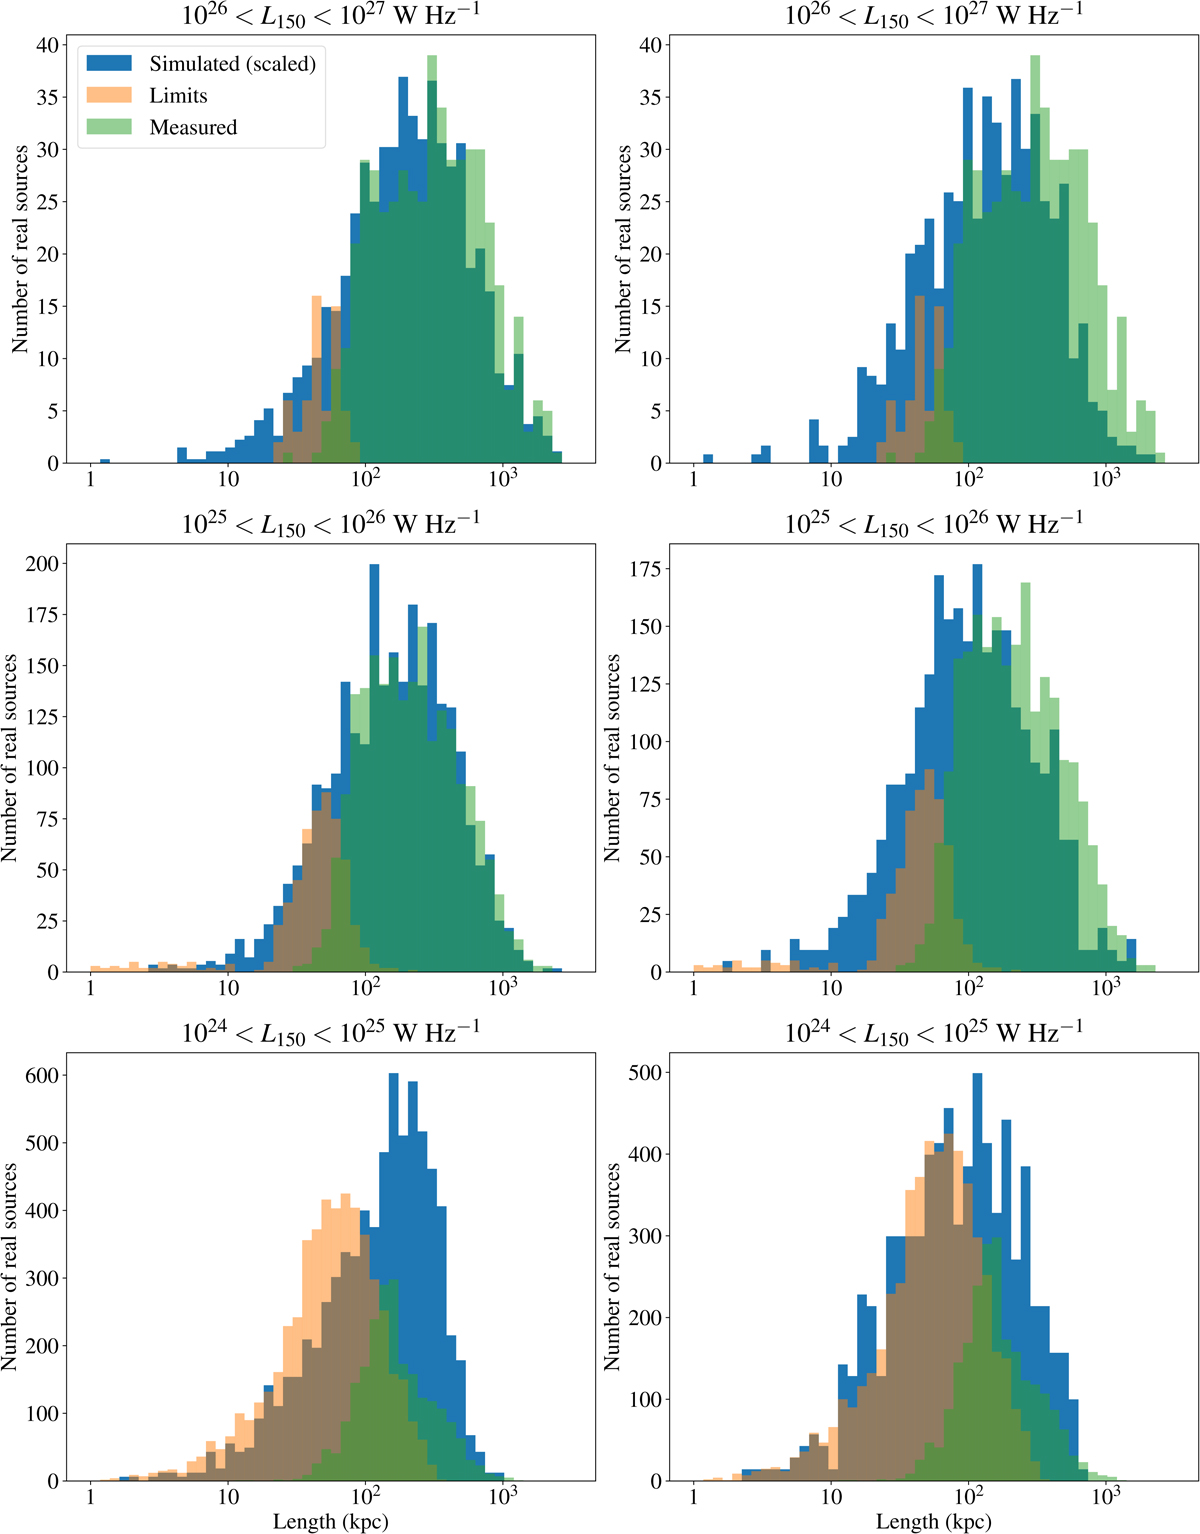
Distributions of real and simulated projected sizes for three luminosity ranges (from top to bottom panels, three slices of the P − D diagram of Fig. 8) and two lifetime distributions (left panels: model (i), uniform, right panels: model (ii), log-uniform).
Current usage metrics show cumulative count of Article Views (full-text article views including HTML views, PDF and ePub downloads, according to the available data) and Abstracts Views on Vision4Press platform.
Data correspond to usage on the plateform after 2015. The current usage metrics is available 48-96 hours after online publication and is updated daily on week days.
Initial download of the metrics may take a while.