Fig. 8.
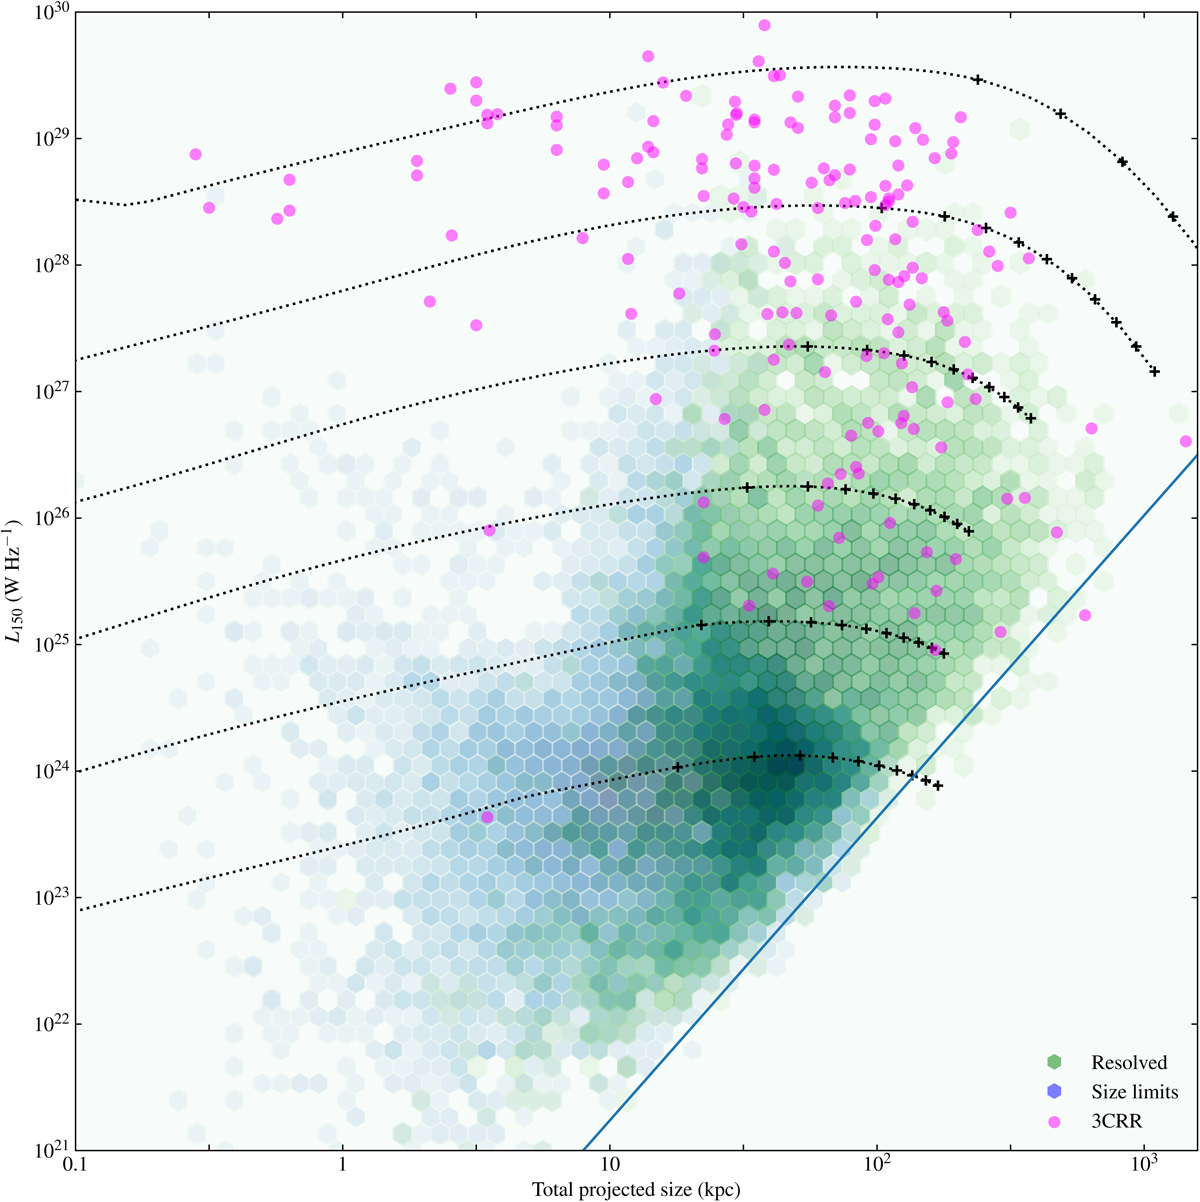
Power/linear size plane (P − D diagram) for the RLAGN sample. Sources that are resolved as defined in Sect. 2.1 are shown in the green density plot; unresolved sources, where the sizes are upper limits, are in blue; and the 3CRR sample (Laing et al. 1983) is overplotted for comparison. There are a total of 6850 resolved and 16 494 unresolved sources on the plot; the colour scales are adjusted so that both groups can be seen. The diagonal blue line shows (qualitatively) the area of the plot in which surface brightness limitations become important, following the analysis of H16. Overplotted are theoretical tracks for z = 0 sources lying in the plane of the sky in a group environment (M500 = 2.5 × 10¹³ M⊙, kT = 1 keV) for two-sided jet powers (from bottom to top) Q = 1035, 1036, …, 1040 W; see the text for details. Crosses on the tracks are plotted at intervals of 50 Myr, where linear size increases monotonically with time; each track lasts for 500 Myr in total.
Current usage metrics show cumulative count of Article Views (full-text article views including HTML views, PDF and ePub downloads, according to the available data) and Abstracts Views on Vision4Press platform.
Data correspond to usage on the plateform after 2015. The current usage metrics is available 48-96 hours after online publication and is updated daily on week days.
Initial download of the metrics may take a while.