Fig. 7.
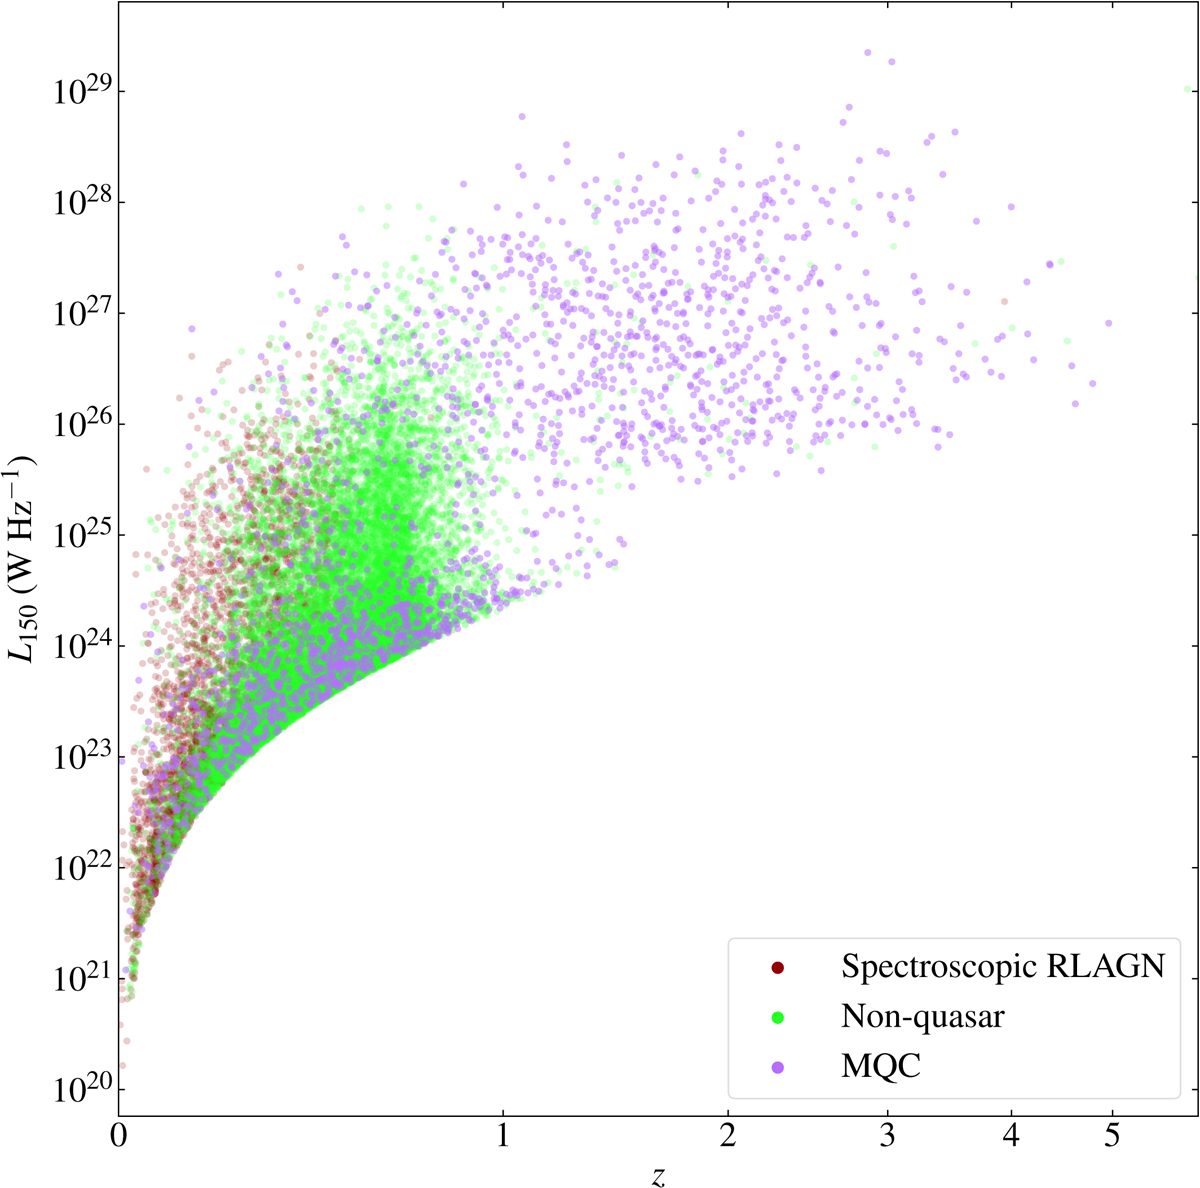
Sampling of the redshift/luminosity plot by the RLAGN sample. The figure distinguishes between FCOZGM RLAGN (“spectroscopic AGN”), objects classified as quasars in the Million Quasar Catalogue (MQC; http://quasars.org/), which are flagged as such in the value-added catalogue (Duncan et al. 2019) and non-quasar AGN selected using the other criteria discussed in Sect. 3. We note that the x-axis shows log(1 + z), labelled linearly.
Current usage metrics show cumulative count of Article Views (full-text article views including HTML views, PDF and ePub downloads, according to the available data) and Abstracts Views on Vision4Press platform.
Data correspond to usage on the plateform after 2015. The current usage metrics is available 48-96 hours after online publication and is updated daily on week days.
Initial download of the metrics may take a while.