Free Access
Fig. 5.
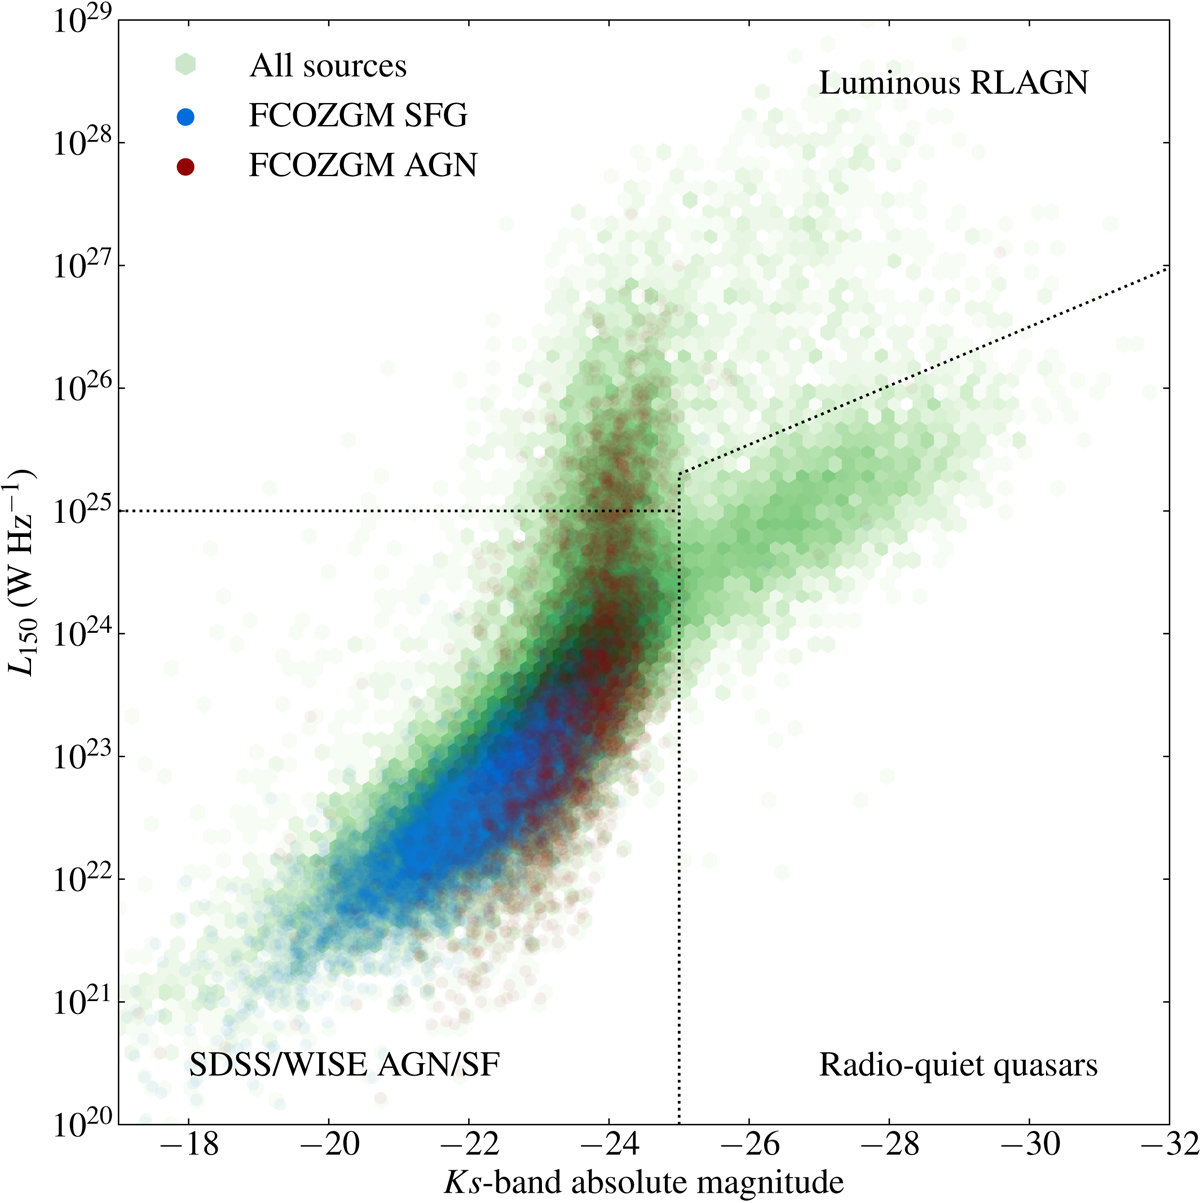
Radio luminosity vs. Ks-band absolute magnitude for the FCOZG sample. Overlaid on the density plot showing the full sample are the locations of FCOZGM RLAGN and FCOZGM SFG. Lines show the divisions on the plot used to select optically classified or radio-luminous AGN.
Current usage metrics show cumulative count of Article Views (full-text article views including HTML views, PDF and ePub downloads, according to the available data) and Abstracts Views on Vision4Press platform.
Data correspond to usage on the plateform after 2015. The current usage metrics is available 48-96 hours after online publication and is updated daily on week days.
Initial download of the metrics may take a while.