Fig. 2.
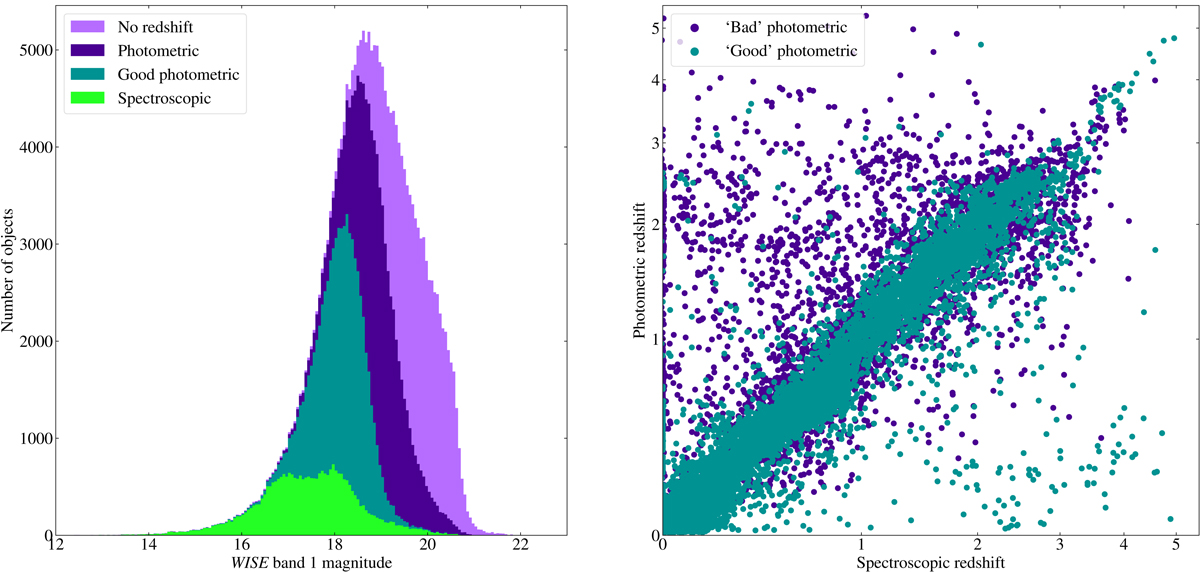
Left panel: histogram of the distribution of WISE band-1 AB magnitudes for optically identified objects in the sample (sample O), colour-coded by the quality of available redshifts (spectroscopic, good photometric with Δz/(1 + z) < 0.1, any photometric, or none). The plot shows 218 600 sources with WISE detections. Right panel: photometric vs. spectroscopic redshift for sources where both are available, showing the distribution of all photometric redshifts and of the good sample.
Current usage metrics show cumulative count of Article Views (full-text article views including HTML views, PDF and ePub downloads, according to the available data) and Abstracts Views on Vision4Press platform.
Data correspond to usage on the plateform after 2015. The current usage metrics is available 48-96 hours after online publication and is updated daily on week days.
Initial download of the metrics may take a while.