Fig. A.2.
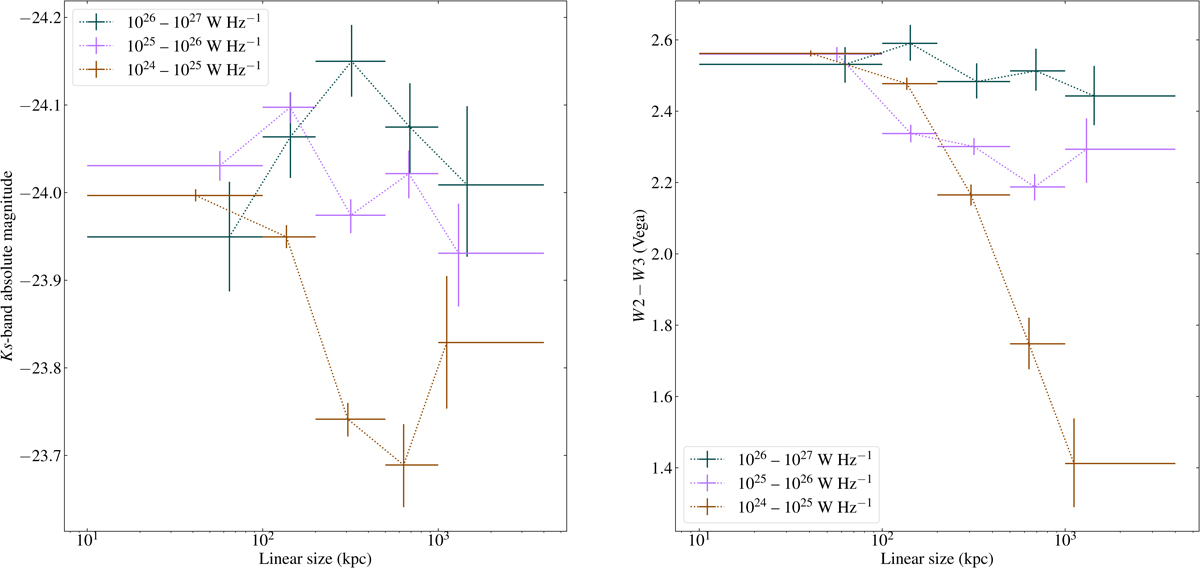
Mean properties of the host galaxies of RLAGN as a function of projected linear size. Left panel: Ks-band rest-frame magnitude. Right panel: WISE band 2 minus band 3 colours (Vega magnitudes). In both plots the vertical error bars represent 1σ errors derived from bootstrap, the horizontal bars represent the bin range, and the position of the central point represents the mean projected linear size within the bin. Dotted lines joining points in a particular sample are to guide the eye only.
Current usage metrics show cumulative count of Article Views (full-text article views including HTML views, PDF and ePub downloads, according to the available data) and Abstracts Views on Vision4Press platform.
Data correspond to usage on the plateform after 2015. The current usage metrics is available 48-96 hours after online publication and is updated daily on week days.
Initial download of the metrics may take a while.