Free Access
Fig. 8.
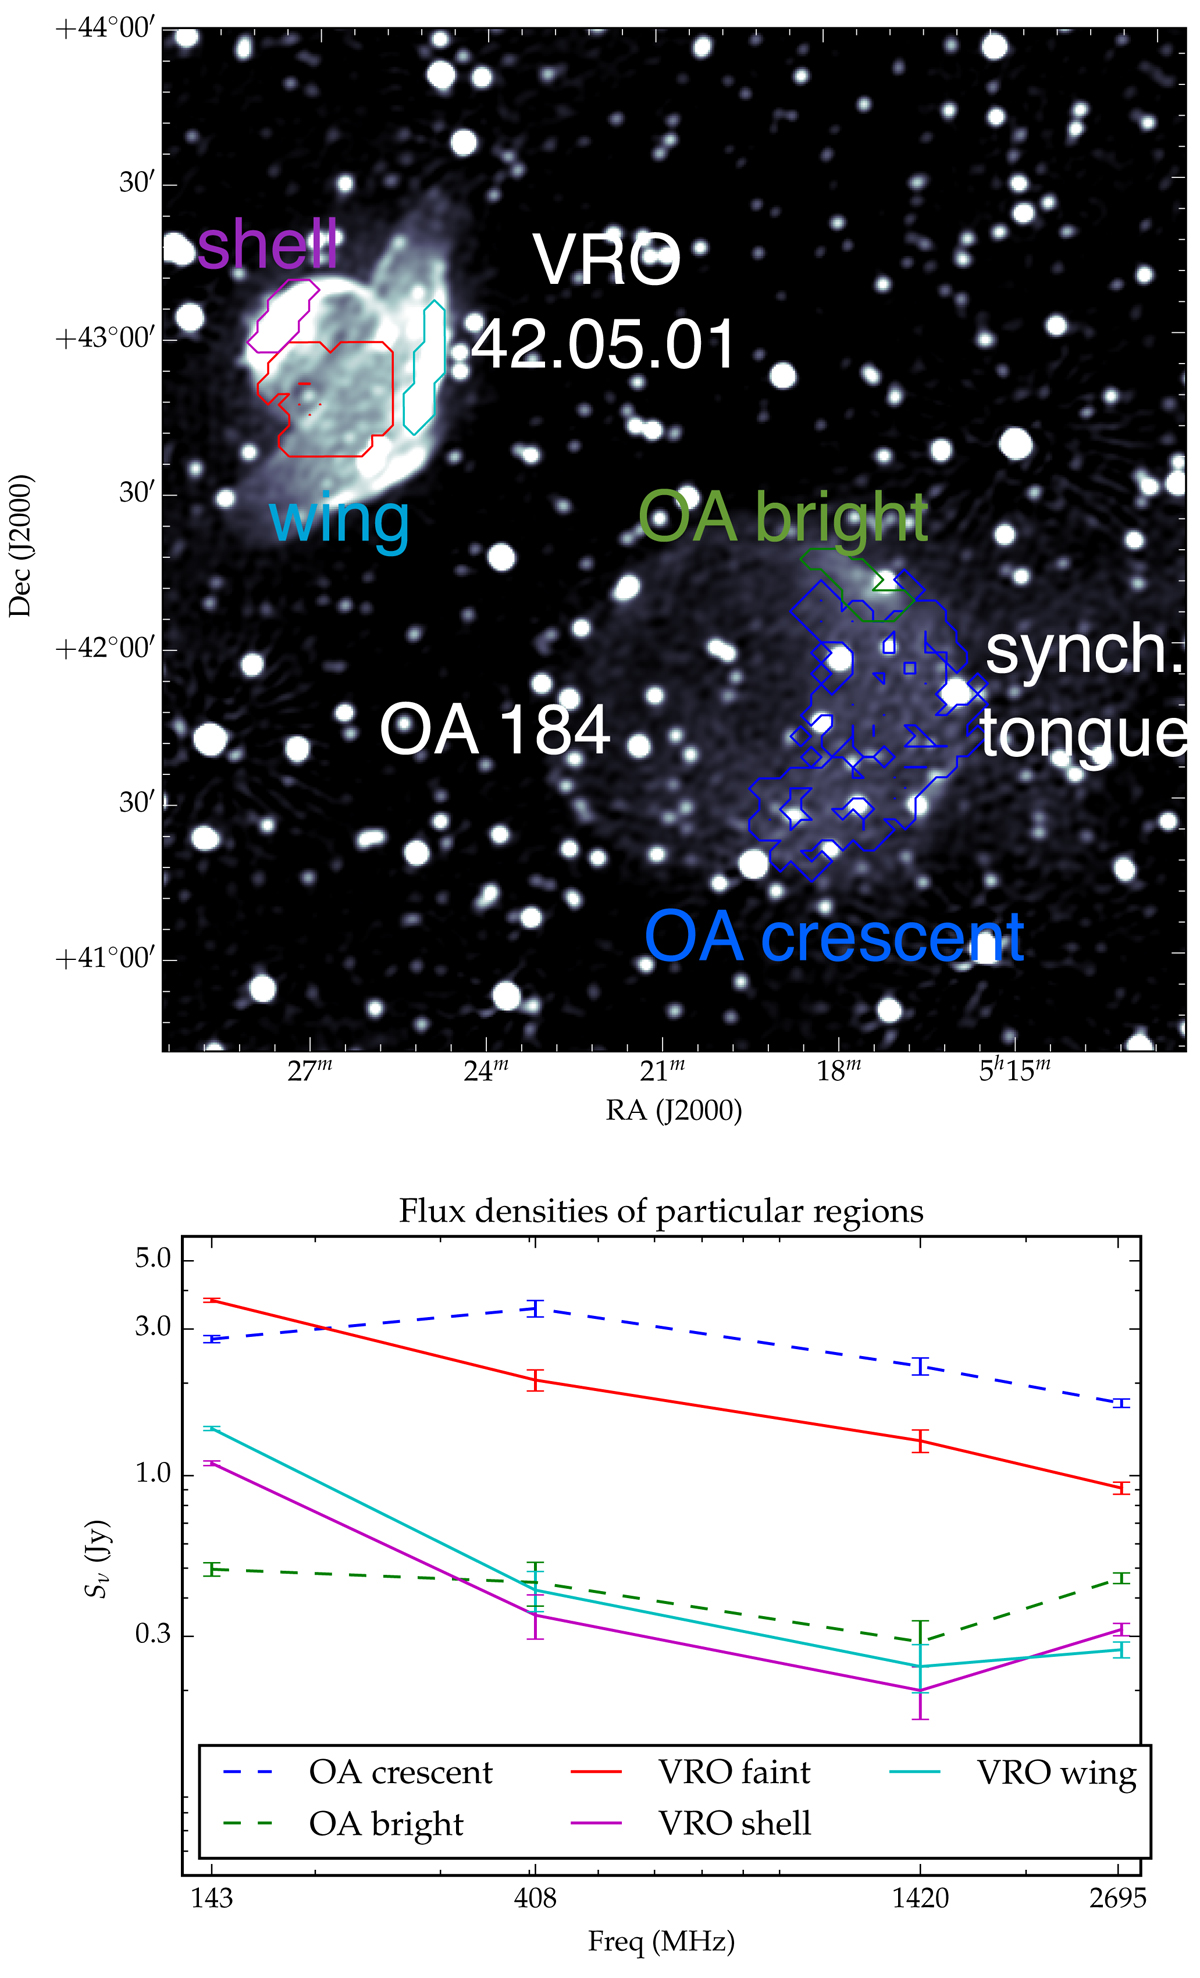
Flux density values of some regions in OA 184 and VRO 42.05.01. The colours in the plot correspond to the regions of the same colour in the map above.
Current usage metrics show cumulative count of Article Views (full-text article views including HTML views, PDF and ePub downloads, according to the available data) and Abstracts Views on Vision4Press platform.
Data correspond to usage on the plateform after 2015. The current usage metrics is available 48-96 hours after online publication and is updated daily on week days.
Initial download of the metrics may take a while.