Fig. 6.
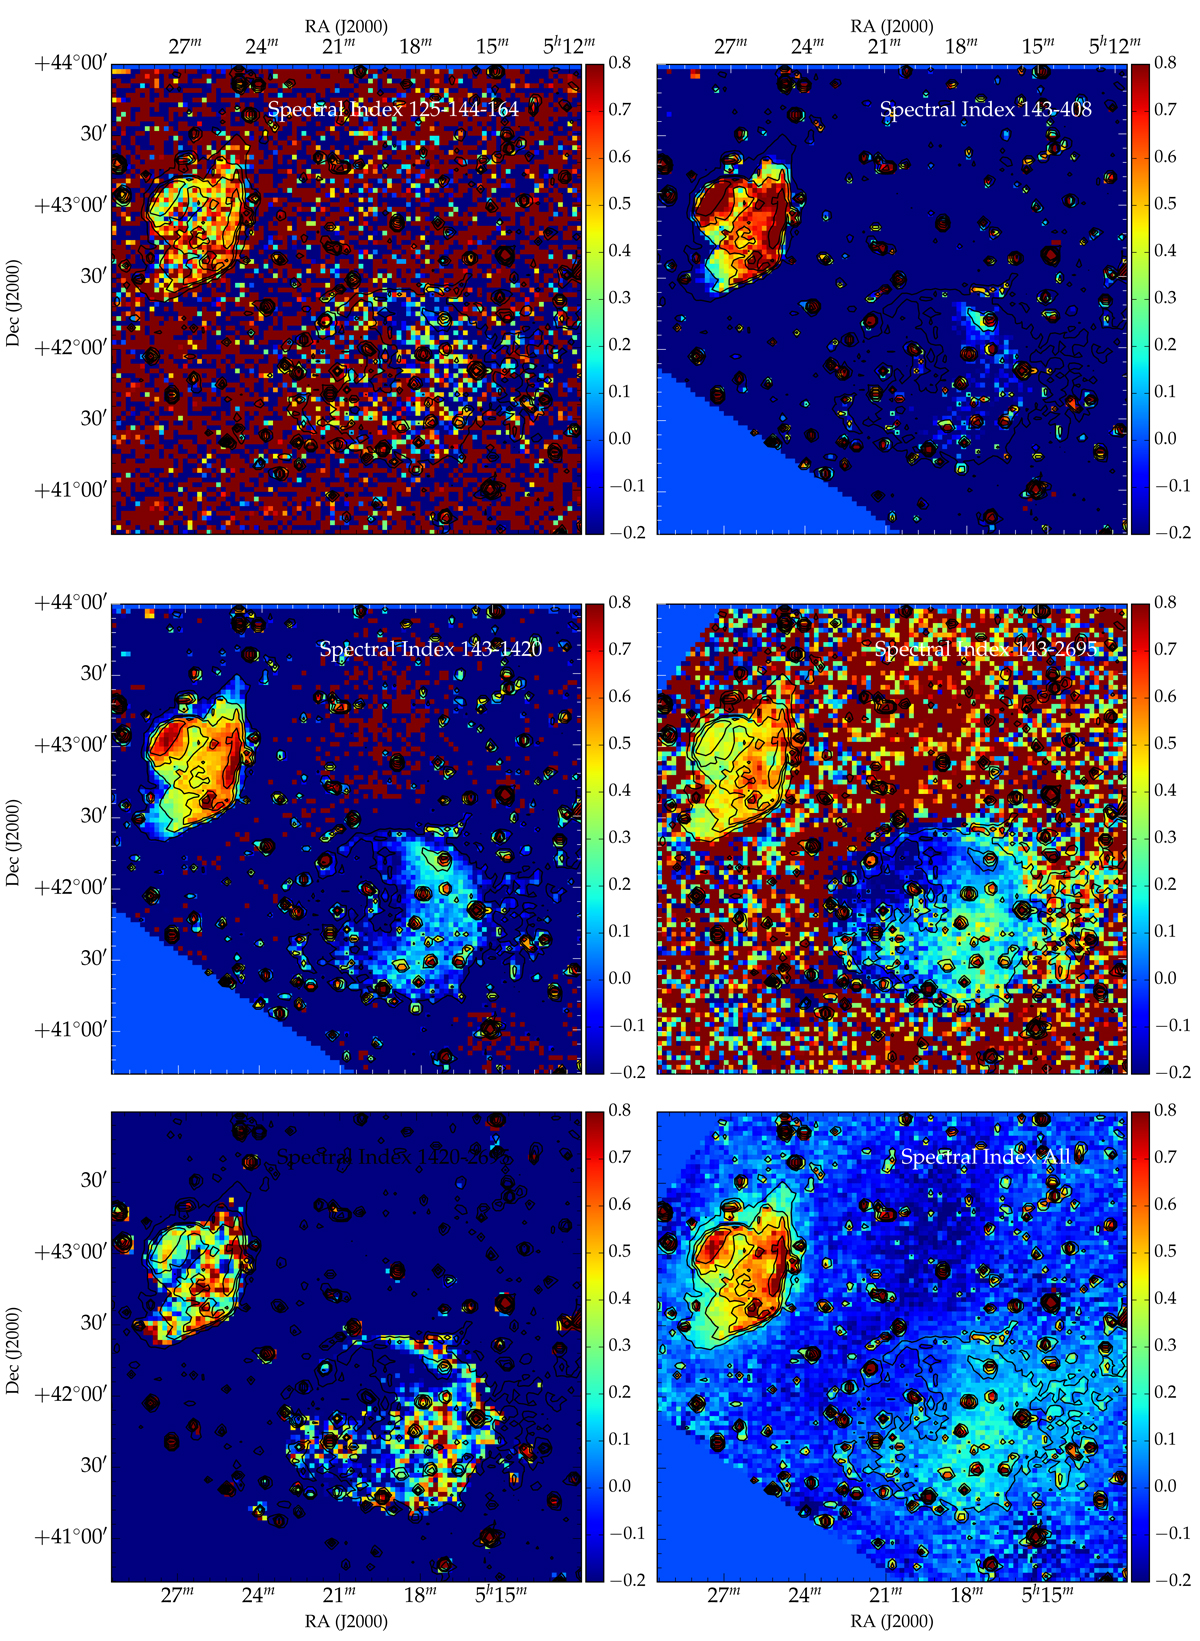
Spectral index maps made from the LOFAR, CGPS, and Effelsberg data. Top left: LOFAR in-band spectral index made from the three narrow-band images described in Sect. 2.3 and presented in the appendix. Top right: 143 MHz–408 MHz (LOFAR to CGPS) spectral index. Middle left: 143 MHz–1420 MHz (LOFAR to CGPS) spectral index. Middle right: 143 MHz–2695 MHz (LOFAR to Effelsberg) spectral index map. Bottom left: spectral index from CGPS and Effelsberg data (1420 MHz–2725 MHz). Bottom right: spectral index map combining all frequencies, as presented in Fig. 4.
Current usage metrics show cumulative count of Article Views (full-text article views including HTML views, PDF and ePub downloads, according to the available data) and Abstracts Views on Vision4Press platform.
Data correspond to usage on the plateform after 2015. The current usage metrics is available 48-96 hours after online publication and is updated daily on week days.
Initial download of the metrics may take a while.