Free Access
Fig. 4.
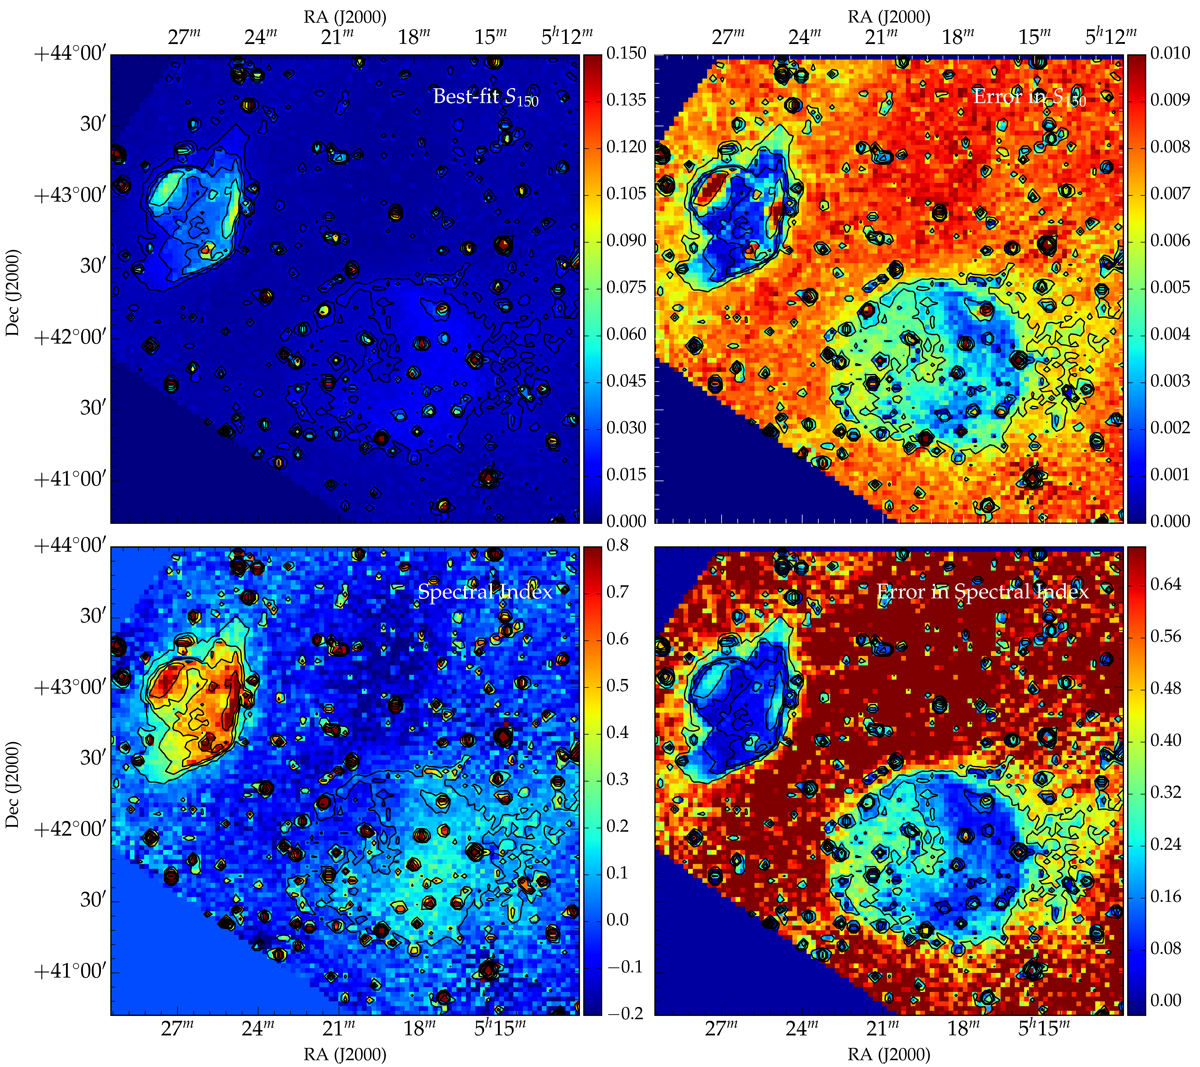
Results of fitting LOFAR, CGPS, and Effelsberg data to Eq. (1). Top left: best-fit amplitude S150 MHz and top right: error in best-fit amplitude ΔS150 MHz. Bottom left: best-fit spectral index value α and bottom right: error in spectral index Δα. The contours are those of the best-fit amplitude S150 MHz.
Current usage metrics show cumulative count of Article Views (full-text article views including HTML views, PDF and ePub downloads, according to the available data) and Abstracts Views on Vision4Press platform.
Data correspond to usage on the plateform after 2015. The current usage metrics is available 48-96 hours after online publication and is updated daily on week days.
Initial download of the metrics may take a while.