Free Access
Fig. 3.
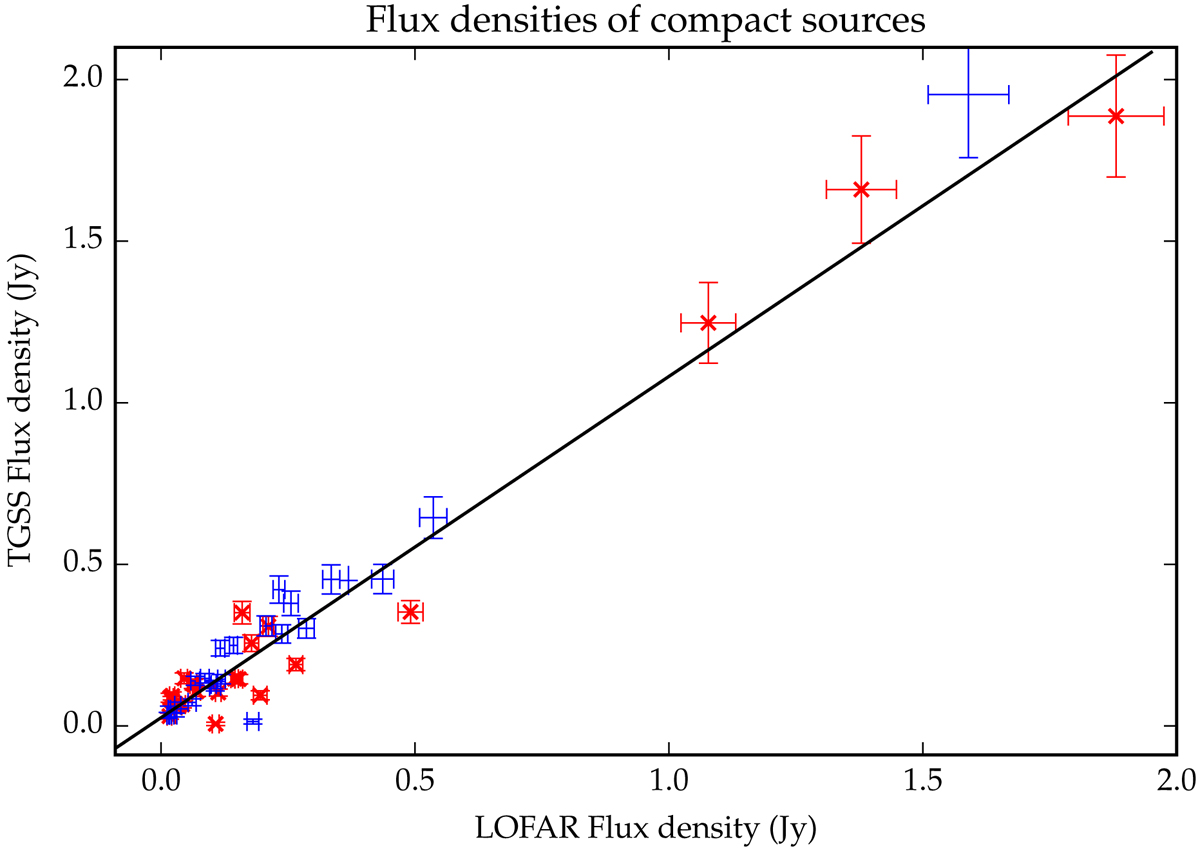
Comparison of flux density values from the LOFAR HBA images at 143 MHz and the TGSS image at 147 MHz of unresolved sources nearby VRO 42.05.01 (red) and OA 184 (blue). The best-fit line in black has slope 1.05 ± 0.08 and intercept 0.025 ± 0.007.
Current usage metrics show cumulative count of Article Views (full-text article views including HTML views, PDF and ePub downloads, according to the available data) and Abstracts Views on Vision4Press platform.
Data correspond to usage on the plateform after 2015. The current usage metrics is available 48-96 hours after online publication and is updated daily on week days.
Initial download of the metrics may take a while.