Fig. 12.
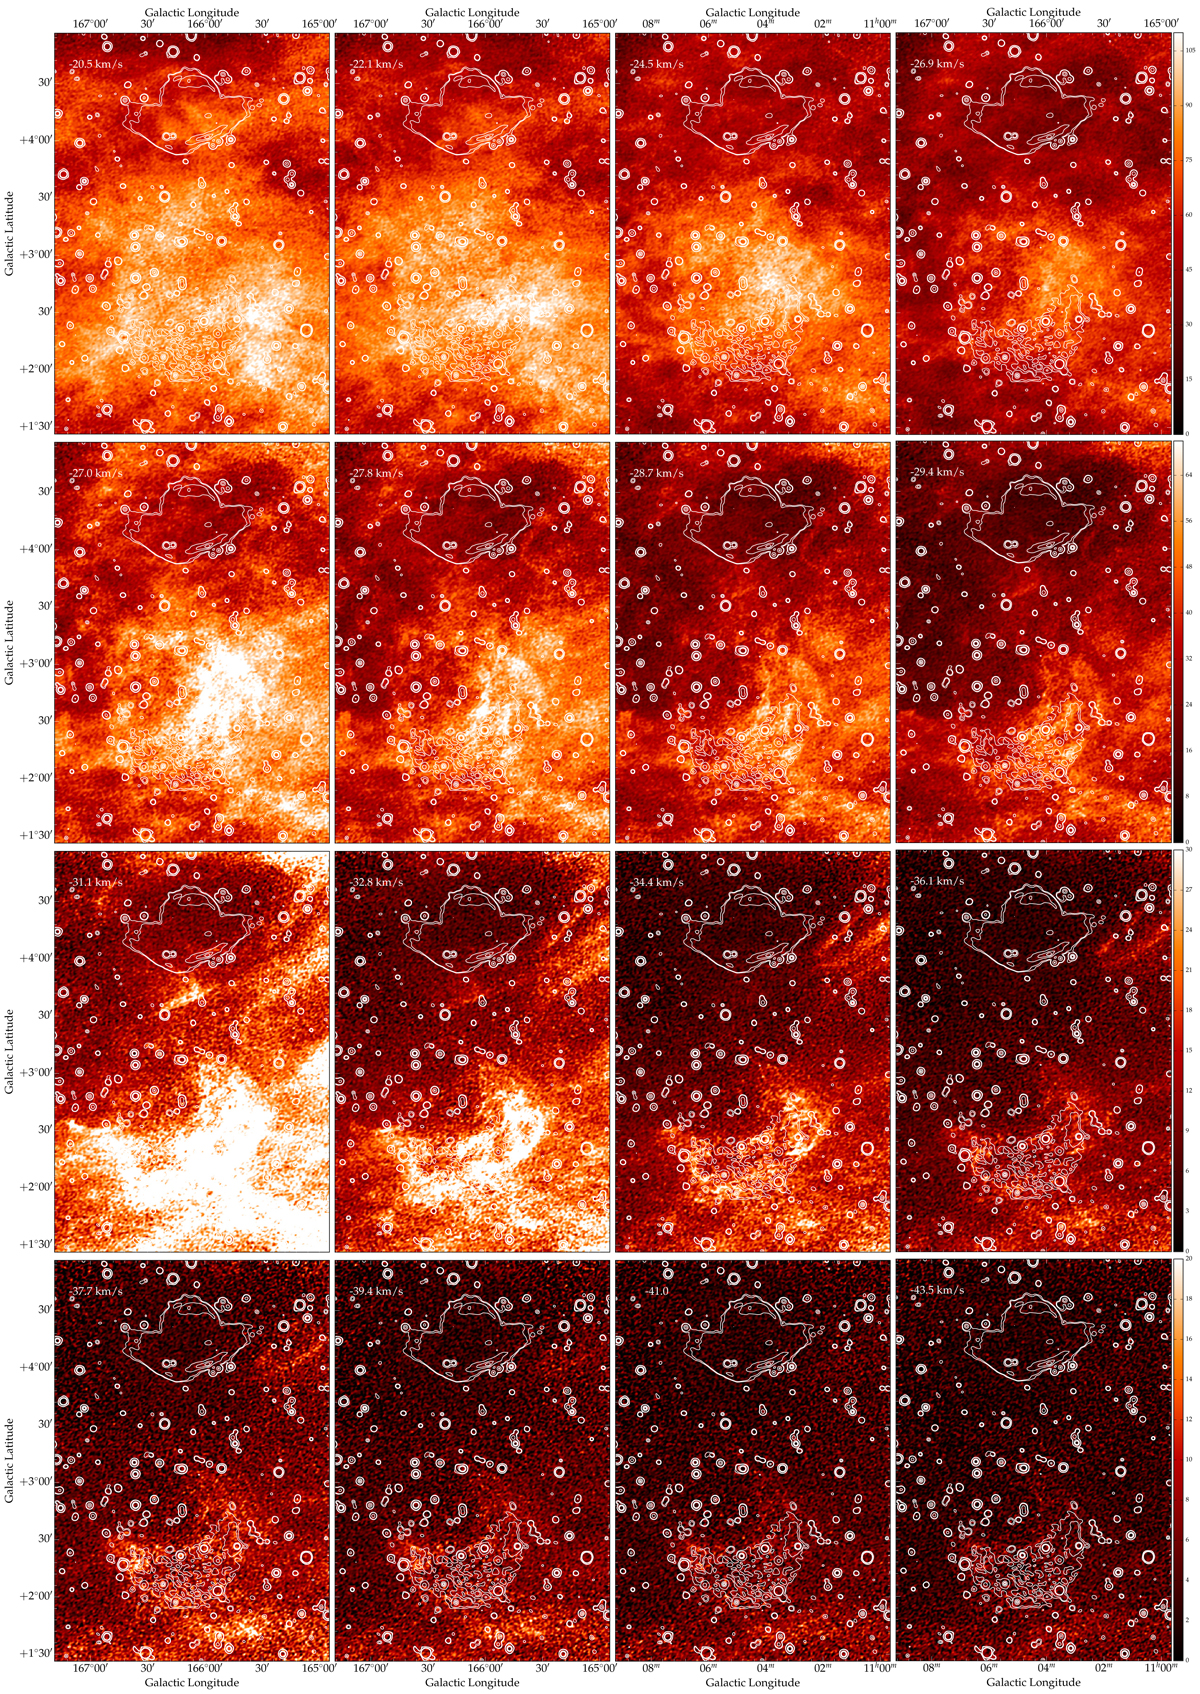
Velocity distribution of HI emission towards VRO 42.05.01 and OA 184. The data cube was taken from the CGPS. The radio contours at 143 MHz from the LOFAR map in this work are overlaid in white. The wedges in the upper left corner of each plot correspond to the velocity of each slice. The brightness temperature TB colour scale is the same for each row and goes as indicated by the colour bar to the left of each row, but it is not the same between rows. The ranges are as follows: first row: 0 − 110 K; second row: 0 − 70 K; third row: 0 − 30 K; and fourth row: 0 − 20 K. We have saturated the emission from OA 184 (bottom) to highlight the fainter emission in the surroundings of VRO 42.05.01.
Current usage metrics show cumulative count of Article Views (full-text article views including HTML views, PDF and ePub downloads, according to the available data) and Abstracts Views on Vision4Press platform.
Data correspond to usage on the plateform after 2015. The current usage metrics is available 48-96 hours after online publication and is updated daily on week days.
Initial download of the metrics may take a while.