Free Access
Fig. 11.
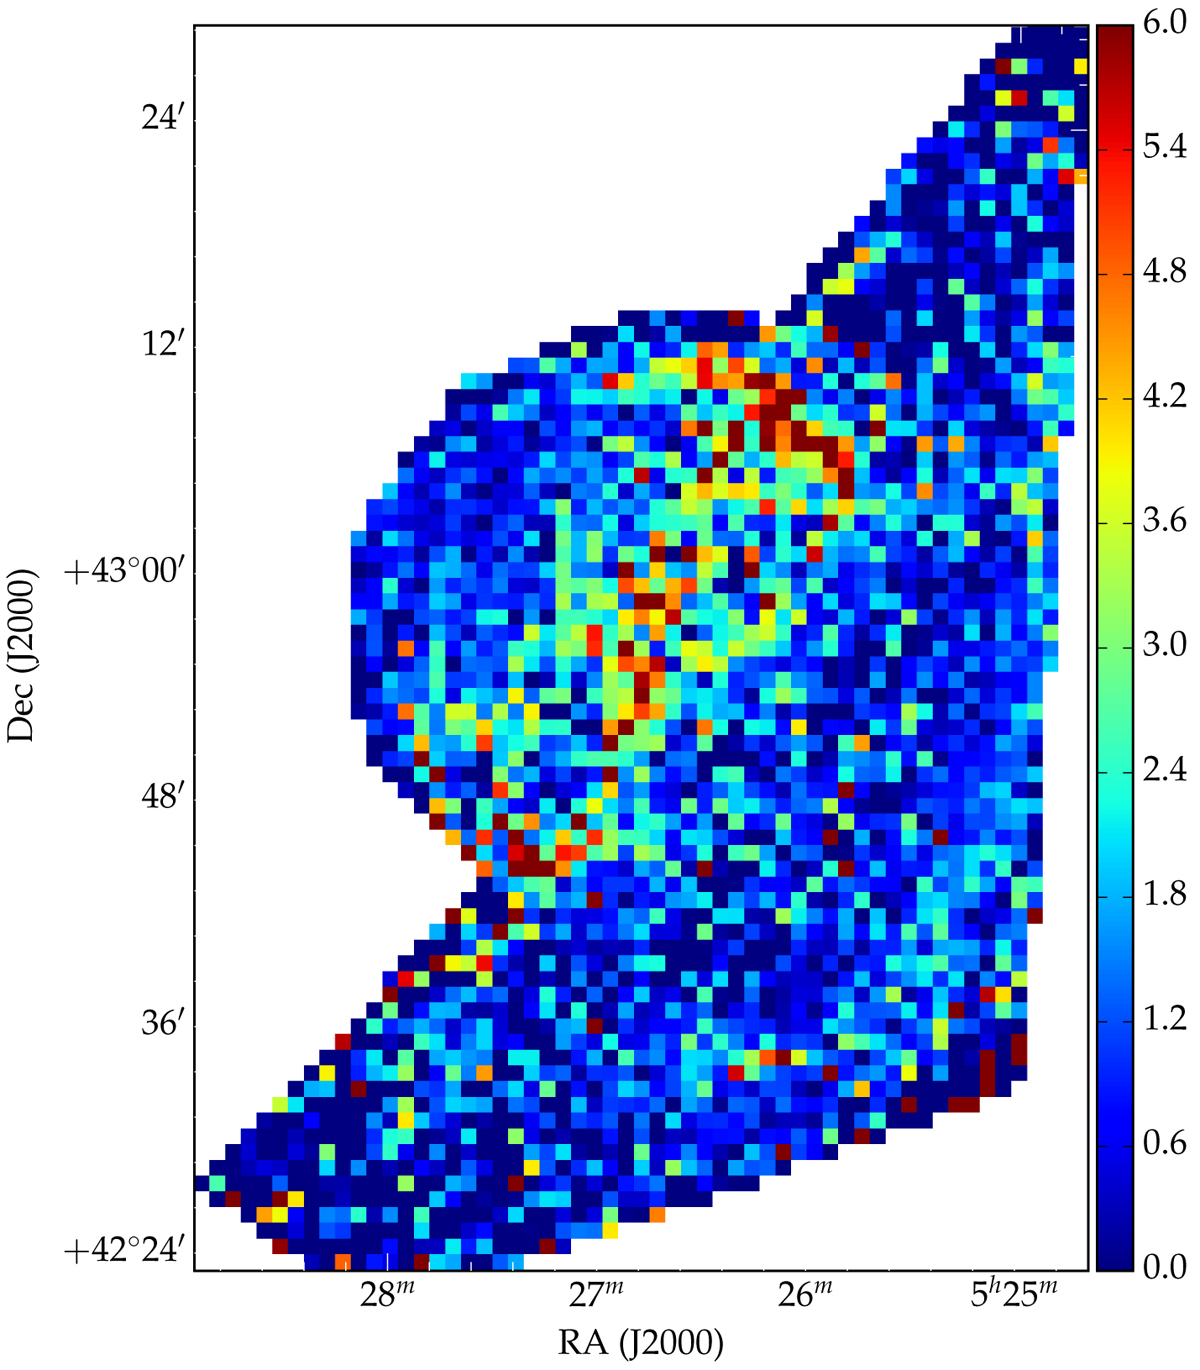
Ratio of optical to radio emission. The Hα map in Fig. 10 was resolved down to match the radio image, and the emission within the masked region of VRO 42.05.01 was normalised to one for both the optical and radio maps before taking the ratio.
Current usage metrics show cumulative count of Article Views (full-text article views including HTML views, PDF and ePub downloads, according to the available data) and Abstracts Views on Vision4Press platform.
Data correspond to usage on the plateform after 2015. The current usage metrics is available 48-96 hours after online publication and is updated daily on week days.
Initial download of the metrics may take a while.