Fig. 3.
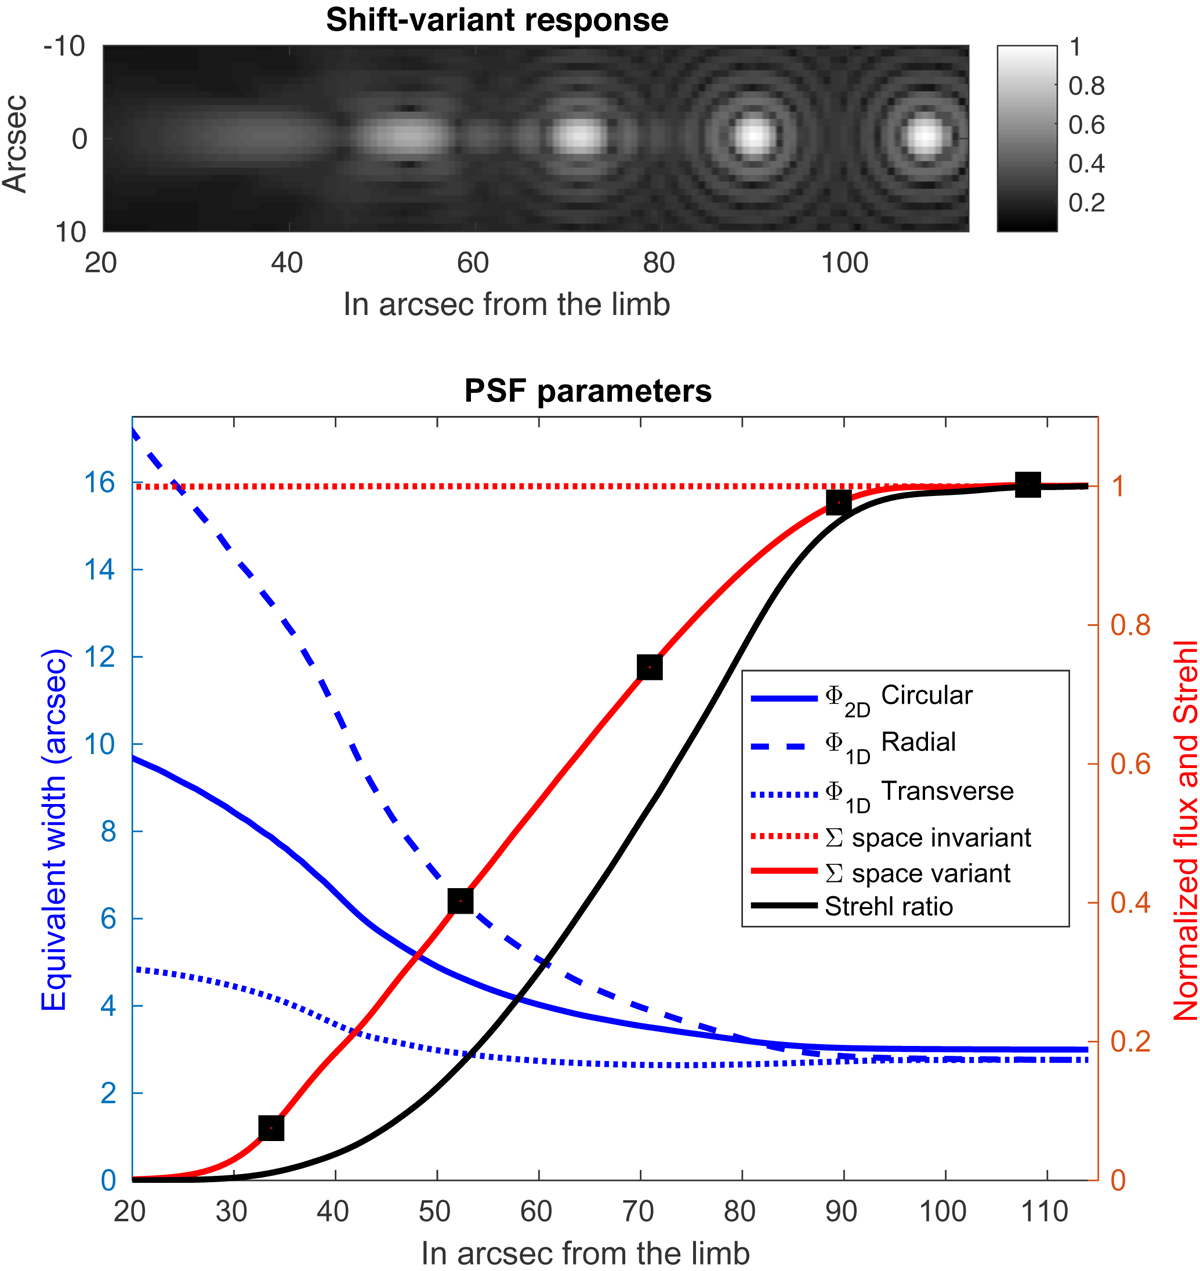
Top panel: responses to unit point sources situated at 33.6, 52.3, 70.9, 89.5, and 108 arcsec from the solar limb for ASPIICS. A non-linear greyscale (intensity to the power 0.2) is used to make the responses more visible. Bottom panel: blue curves, left y axis, resolutions in terms of 1D (radial and transverse) widths, and 2D integrated widths, and red curves, right y axis, integrated PSFs normalized to 1 for the invariant response. The black curve gives the Strehl ratio. Points (black squares) are at positions of the PSFs shown in the top panel.
Current usage metrics show cumulative count of Article Views (full-text article views including HTML views, PDF and ePub downloads, according to the available data) and Abstracts Views on Vision4Press platform.
Data correspond to usage on the plateform after 2015. The current usage metrics is available 48-96 hours after online publication and is updated daily on week days.
Initial download of the metrics may take a while.