Open Access
Fig. 9.
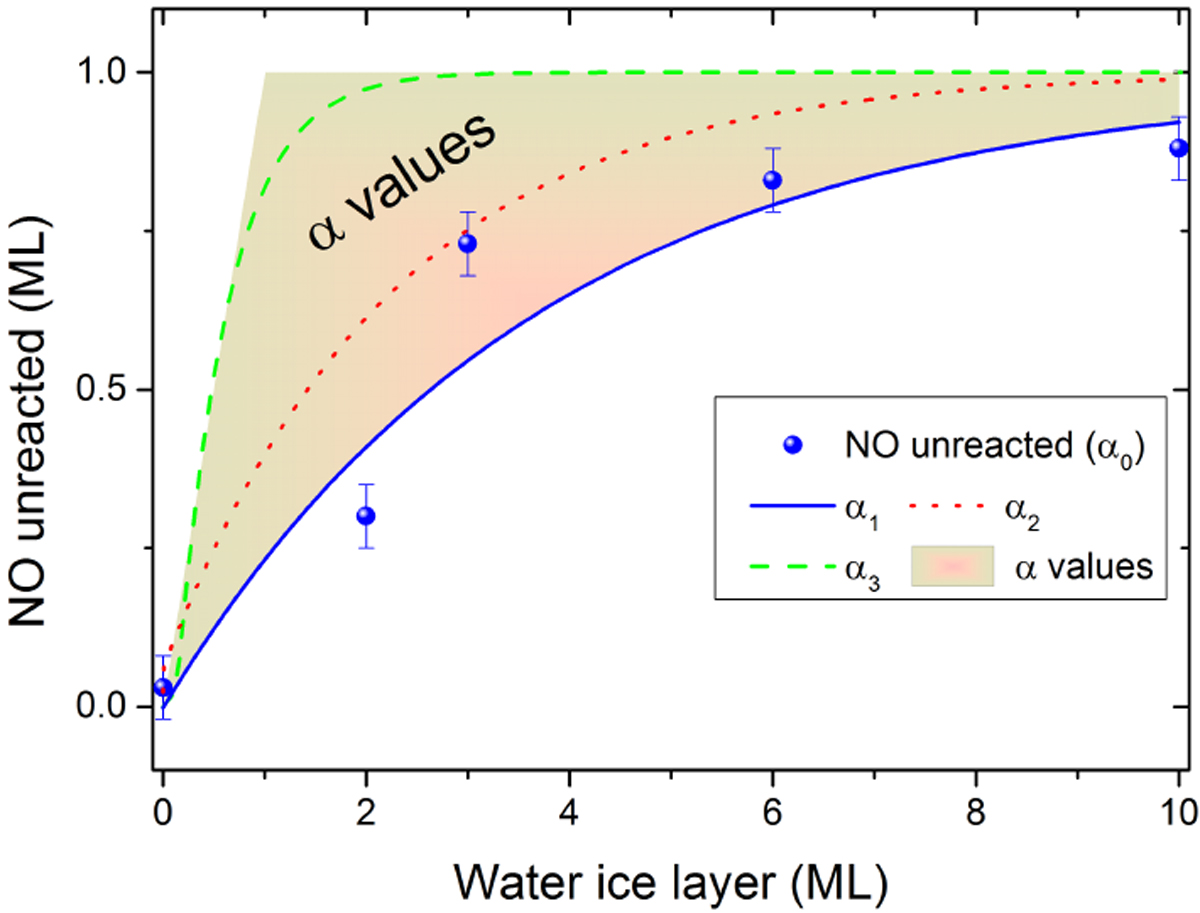
Colored zone: possible values of NO located inside the bulk of ice (NOb = α) as a function of the WIL thickness. Blue points: measured amounts of unreacted NO. Blue, red, and green lines represent three possible parametrized repartitions of initially covered NO molecules
Current usage metrics show cumulative count of Article Views (full-text article views including HTML views, PDF and ePub downloads, according to the available data) and Abstracts Views on Vision4Press platform.
Data correspond to usage on the plateform after 2015. The current usage metrics is available 48-96 hours after online publication and is updated daily on week days.
Initial download of the metrics may take a while.