Open Access
Fig. 5.
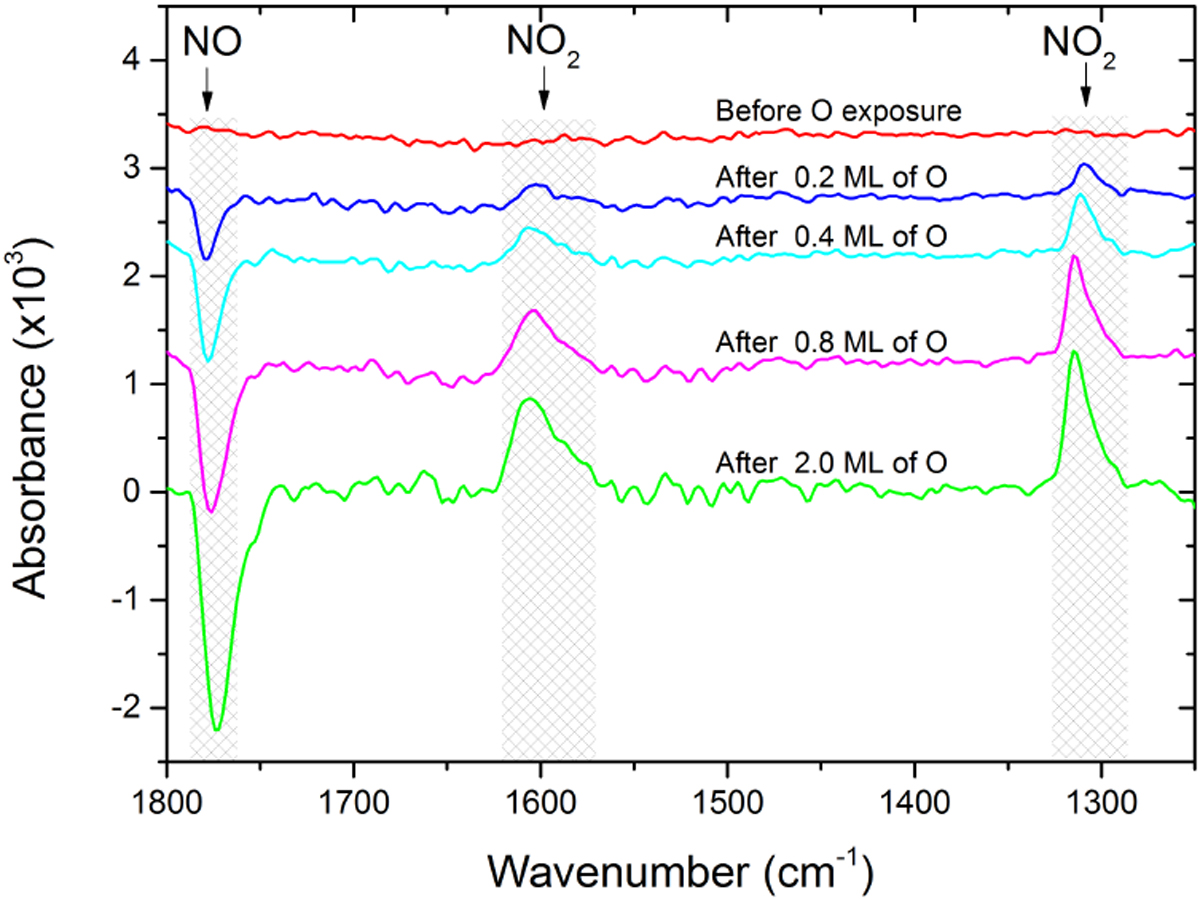
Infrared spectra obtained by exposing to 1 mL of NO held at 40 K to different amount of O atoms: 0, 0.2, 0.4, 0.8, and 2.0 mL. The red curve does not present any IR signature since it has been considered as the reference spectrum. Curves are offset for clarity.
Current usage metrics show cumulative count of Article Views (full-text article views including HTML views, PDF and ePub downloads, according to the available data) and Abstracts Views on Vision4Press platform.
Data correspond to usage on the plateform after 2015. The current usage metrics is available 48-96 hours after online publication and is updated daily on week days.
Initial download of the metrics may take a while.