Fig. 10.
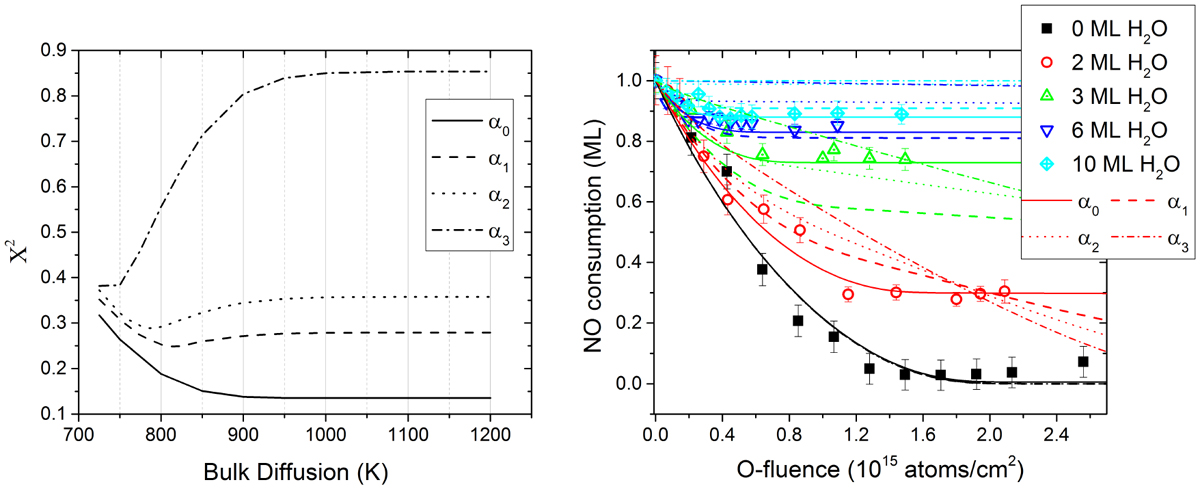
Left panel: χ2 values comparing model and data for different α laws as a function of bulk diffusion energy. The value α0 corresponds to the exact experimental values of unreacted species. Right panel: comparison between model (lines) and experimental data (dots). Experimental data are obtained by integrating IR peaks of NO and NO2 as a function of O-atom fluence for five different thickness of water ices (0, 2, 3, 6, and 10 mL) held at 40 K. Simulated curves are obtained by using three laws for the α parameter (α1, α2, and α3) and measured experimental values (α0) for the best case corresponding to the minimum χ2 of left panel. For α0 any choice of diffusion parameter greater than 950 K gives similar results.
Current usage metrics show cumulative count of Article Views (full-text article views including HTML views, PDF and ePub downloads, according to the available data) and Abstracts Views on Vision4Press platform.
Data correspond to usage on the plateform after 2015. The current usage metrics is available 48-96 hours after online publication and is updated daily on week days.
Initial download of the metrics may take a while.