Fig. 8.
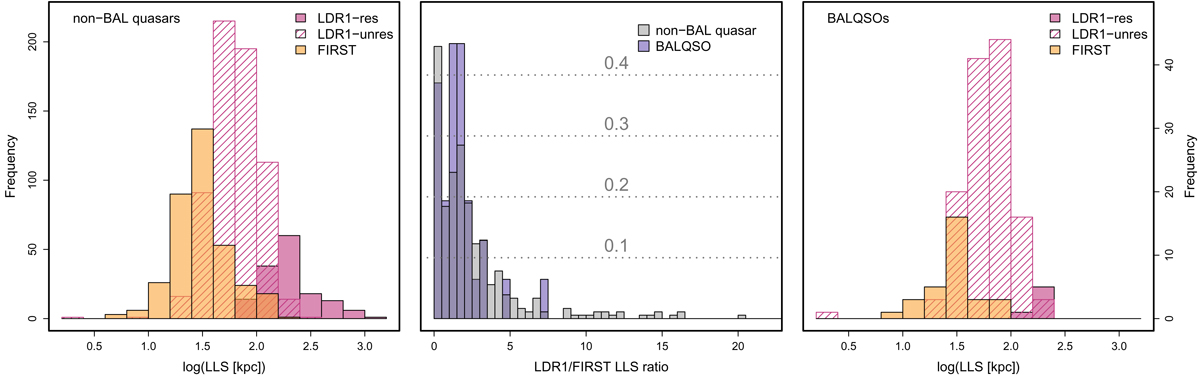
Left panel: distribution of largest linear sizes in LDR1 (pink) and FIRST (orange) for non-BAL quasars. The pink hatched area represents unresolved sources in LDR1, and the solid pink area represents resolved sources in LDR1. Centre panel: normalised distributions of LDR1/FIRST LLS ratios for non-BAL quasars (grey) and BALQSOs (purple). There are five sources with extreme ratios (25 < LLS < 70) which are not pictured here. Right panel: distribution of largest linear sizes of BALQSOs in LDR1 (pink) and FIRST (orange). The hatched and solid areas are for unresolved and resolved sources in LDR1, respectively.
Current usage metrics show cumulative count of Article Views (full-text article views including HTML views, PDF and ePub downloads, according to the available data) and Abstracts Views on Vision4Press platform.
Data correspond to usage on the plateform after 2015. The current usage metrics is available 48-96 hours after online publication and is updated daily on week days.
Initial download of the metrics may take a while.