| Issue |
A&A
Volume 640, August 2020
LOFAR Surveys: a new window on the Universe
|
|
|---|---|---|
| Article Number | C4 | |
| Number of page(s) | 4 | |
| Section | Extragalactic astronomy | |
| DOI | https://doi.org/10.1051/0004-6361/201833821e | |
| Published online | 13 August 2020 | |
The origin of radio emission in broad absorption line quasars: Results from the LOFAR Two-metre Sky Survey (Corrigendum)
1
Astrophysics, University of Oxford, Denys Wilkinson Building, Keble Road, Oxford OX1 3RH, UK
e-mail: This email address is being protected from spambots. You need JavaScript enabled to view it.
2
SUPA, Institute for Astronomy, Royal Observatory, Blackford Hill, Edinburgh EH9 3HJ, UK
3
CSIRO Astronomy and Space Science, PO Box 1130, Bentley, WA 6102, Australia
4
Department of Physics, University of the Western Cape, Cape Town 7535, South Africa
5
INAF- Istituto di Radioastronomia, Via P. Gobetti 101, 40129 Bologna, Italy
6
Leiden Observatory, Leiden University, PO Box 9513, 2300 RA Leiden, The Netherlands
7
Centre for Astrophysics Research, School of Physics, Astronomy and Mathematics, University of Hertfordshire, College Lane, Hatfield AL10 9AB, UK
8
Toruń Centre for Astronomy, Faculty of Physics, Astronomy and Informatics, NCU, Grudziacka 5, 87-100 Toruń, Poland
9
School of Physics, University College Dublin, Belfield, Dublin 4, UK
10
ASTRON, The Netherlands Institute for Radio Astronomy, Postbus 2, 7990, AA Dwingeloo, The Netherlands
11
GEPI & USN, Observatoire de Paris, Université PSL, CNRS, 5 Place Jules Janssen, 92190 Meudon, France
12
Department of Physics & Electronics, Rhodes University, PO Box 94, Grahamstown 6140, South Africa
Abstract
We report an erratum in Morabito et al. (2019, A&A, 622, A15). When calculating radio powers from observed flux densities, the wrong sign convention was used. This resulted in an underestimation of the radio powers by a median value of 0.6 dex and a maximum of 1 dex. The conclusions of the paper are unchanged.
Key words: galaxies: active / galaxies: jets / radio continuum: galaxies / quasars: general / radiation mechanisms: non-thermal / errata, addenda
© ESO 2020
When calculating rest-frame radio power at a specific frequency, it is necessary to account for the shape of the radio spectral energy distribution. Typically this is a synchrotron spectrum described by Sν ∝ να, which we use to correct observed flux density to intrinsic luminosity at a specific wavelength:
 (1)
(1)
In Morabito et al. (2019), we incorrectly used the opposite sign convention for α; as defined correctly above a typical value of α is −0.7. Figure 1 shows the correct, recalculated radio powers versus the original radio powers reported in the original paper. The conclusions of the paper are unchanged, as the key observational trends are unaffected by this shift in radio power.
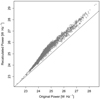 |
Fig. 1. Correct radio power versus original radio power calculated in Morabito et al. (2019). The black line one-to-one relation is drawn to guide the eye. |
Table 1 remains unchanged, while Tables 2 and 3 have very marginal changes (within the uncertainties). The tables with the corrected values are reproduced below.
Half of the figures remain unchanged. We reproduce Figs. 3, 5, 6, 7, 10, 11, and 12 here with the corrected values of radio power (and therefore also radio loudness). Wherever possible, we left the Figure axes limits unchanged to facilitate comparison with Morabito et al. (2019), and only changed them when necessary to see the relevant data trends.
Weighted median spectral index values and bootstrapped uncertainties, for sources detected at both frequencies.
Spearman’s rank correlation coefficients between HiBAL and LoBAL radio properties and BI.
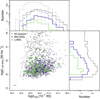 |
Fig. 3. Radio luminosity vs. bolometric luminosity. Light gray points are all quasars with LoTSS detections, and purple points are those classified as BALQSO. The median errors are shown by the cross in the bottom left of the plot. Top panel: distributions of bolometric luminosity: solid lines represent the LoTSS-detected samples, while dot-dashed lines represent all sources regardless of LoTSS-detection. Right panel: distributions of radio luminosity for LoTSS-detected sources. The line colours are the same as in the scatter plot. |
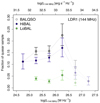 |
Fig. 5. Fraction of BALQSOs and LoBALs in the overall quasar sample as a function of radio luminosity at 144 MHz. The abscissa are luminosity bin midpoints. The highest luminosity bin may be heavily biased by the small number of sources and the limited sky coverage; these points have been shaded out. |
Figure 7 shows the distribution of radio loudness. The division of radio loud/radio quiet is somewhat arbitrary, but the intention is to distinguish between the Gaussian-like distribution of radio quiet sources and the tail of radio loud sources; these are seen as two distinct components in the overall distribution of radio loudness. At GHz frequencies, this division is typically around values of log(R)∼1. Based on our incorrect radio powers at 144 MHz in Morabito et al. (2019), we drew this division at log(R144) = 2. Visually inspecting the revised distribution in Fig. 7 the break between radio quiet and radio loud has shifted log(R144) = 2.6, where the distribution in the non-BAL quasar population dips and then the radio-loud tail picks up.
In Fig. 10, while some points have shifted slightly, the radio powers for 1.4 GHz and 144 MHz were both re-calculated, leaving the spectral index values virtually unchanged for sources with measurements at both frequencies. The upper limits for the spectral indices are the most drastic change (these values were not used anywhere in Morabito et al. 2019).
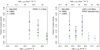 |
Fig. 6. Left: fraction of BALQSOs, LoBALs, and HiBALs in the overall quasar sample as a function of radio luminosity at 1.4 GHz for the sources with FIRST counterparts. Right: fraction of BALQSOs, LoBALs, and HiBALs in the overall quasar sample as a function of radio luminosity at 144 MHz, but for only the sources with FIRST counterparts. The highest luminosity bin may be heavily biased by the small number of sources and the limited sky coverage; these points have been shaded out. |
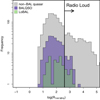 |
Fig. 7. Distributions of radio loudness of non-BAL quasars, BALQSOs, and LoBALs. |
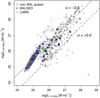 |
Fig. 10. Radio luminosity from LDR1 vs. FIRST measurements. Lines of constant spectral index are drawn on the plot, with the appropriate labels. Upper limits for sources are detected in LDR1 but not FIRST are shown as left-pointing arrows. The median uncertainties for detections (i.e., not upper limits) are shown as a cross in the bottom right corner of the plot. |
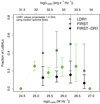 |
Fig. 11. Fraction of BALQSOs which are LoBALs, as a function of radio luminosity. We have included fractions as a function of both LoTSS and FIRST powers. To aid the comparison, we have shifted the LoTSS radio luminosity abscissa by an amount equivalent to the median spectral index between the LoTSS/FIRST samples. Both observed and adjusted FIRST values are plotted, where the adjusted values have been reduced by the fraction of DR7 FIRST detections to LoTSS/FIRST cross-matched detections. |
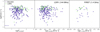 |
Fig. 12. Balnicity index (BI) as a function of, from left to right: log(R144 MHz), L144 MHz, L1.4 GHz. Median errors in both the x and y directions are shown in the bottom left corner of each plot. |
Acknowledgments
The authors wish to thank A. Rankine for bringing this to our attention.
References
- Morabito, L. K., Matthews, J. H., Best, P. N., et al. 2019, A&A, 622, A15 [NASA ADS] [CrossRef] [EDP Sciences] [Google Scholar]
All Tables
Weighted median spectral index values and bootstrapped uncertainties, for sources detected at both frequencies.
Spearman’s rank correlation coefficients between HiBAL and LoBAL radio properties and BI.
All Figures
|
Fig. 1. Correct radio power versus original radio power calculated in Morabito et al. (2019). The black line one-to-one relation is drawn to guide the eye. |
| In the text | |
|
Fig. 3. Radio luminosity vs. bolometric luminosity. Light gray points are all quasars with LoTSS detections, and purple points are those classified as BALQSO. The median errors are shown by the cross in the bottom left of the plot. Top panel: distributions of bolometric luminosity: solid lines represent the LoTSS-detected samples, while dot-dashed lines represent all sources regardless of LoTSS-detection. Right panel: distributions of radio luminosity for LoTSS-detected sources. The line colours are the same as in the scatter plot. |
| In the text | |
|
Fig. 5. Fraction of BALQSOs and LoBALs in the overall quasar sample as a function of radio luminosity at 144 MHz. The abscissa are luminosity bin midpoints. The highest luminosity bin may be heavily biased by the small number of sources and the limited sky coverage; these points have been shaded out. |
| In the text | |
|
Fig. 6. Left: fraction of BALQSOs, LoBALs, and HiBALs in the overall quasar sample as a function of radio luminosity at 1.4 GHz for the sources with FIRST counterparts. Right: fraction of BALQSOs, LoBALs, and HiBALs in the overall quasar sample as a function of radio luminosity at 144 MHz, but for only the sources with FIRST counterparts. The highest luminosity bin may be heavily biased by the small number of sources and the limited sky coverage; these points have been shaded out. |
| In the text | |
|
Fig. 7. Distributions of radio loudness of non-BAL quasars, BALQSOs, and LoBALs. |
| In the text | |
|
Fig. 10. Radio luminosity from LDR1 vs. FIRST measurements. Lines of constant spectral index are drawn on the plot, with the appropriate labels. Upper limits for sources are detected in LDR1 but not FIRST are shown as left-pointing arrows. The median uncertainties for detections (i.e., not upper limits) are shown as a cross in the bottom right corner of the plot. |
| In the text | |
|
Fig. 11. Fraction of BALQSOs which are LoBALs, as a function of radio luminosity. We have included fractions as a function of both LoTSS and FIRST powers. To aid the comparison, we have shifted the LoTSS radio luminosity abscissa by an amount equivalent to the median spectral index between the LoTSS/FIRST samples. Both observed and adjusted FIRST values are plotted, where the adjusted values have been reduced by the fraction of DR7 FIRST detections to LoTSS/FIRST cross-matched detections. |
| In the text | |
|
Fig. 12. Balnicity index (BI) as a function of, from left to right: log(R144 MHz), L144 MHz, L1.4 GHz. Median errors in both the x and y directions are shown in the bottom left corner of each plot. |
| In the text | |
Current usage metrics show cumulative count of Article Views (full-text article views including HTML views, PDF and ePub downloads, according to the available data) and Abstracts Views on Vision4Press platform.
Data correspond to usage on the plateform after 2015. The current usage metrics is available 48-96 hours after online publication and is updated daily on week days.
Initial download of the metrics may take a while.