Fig. 3.
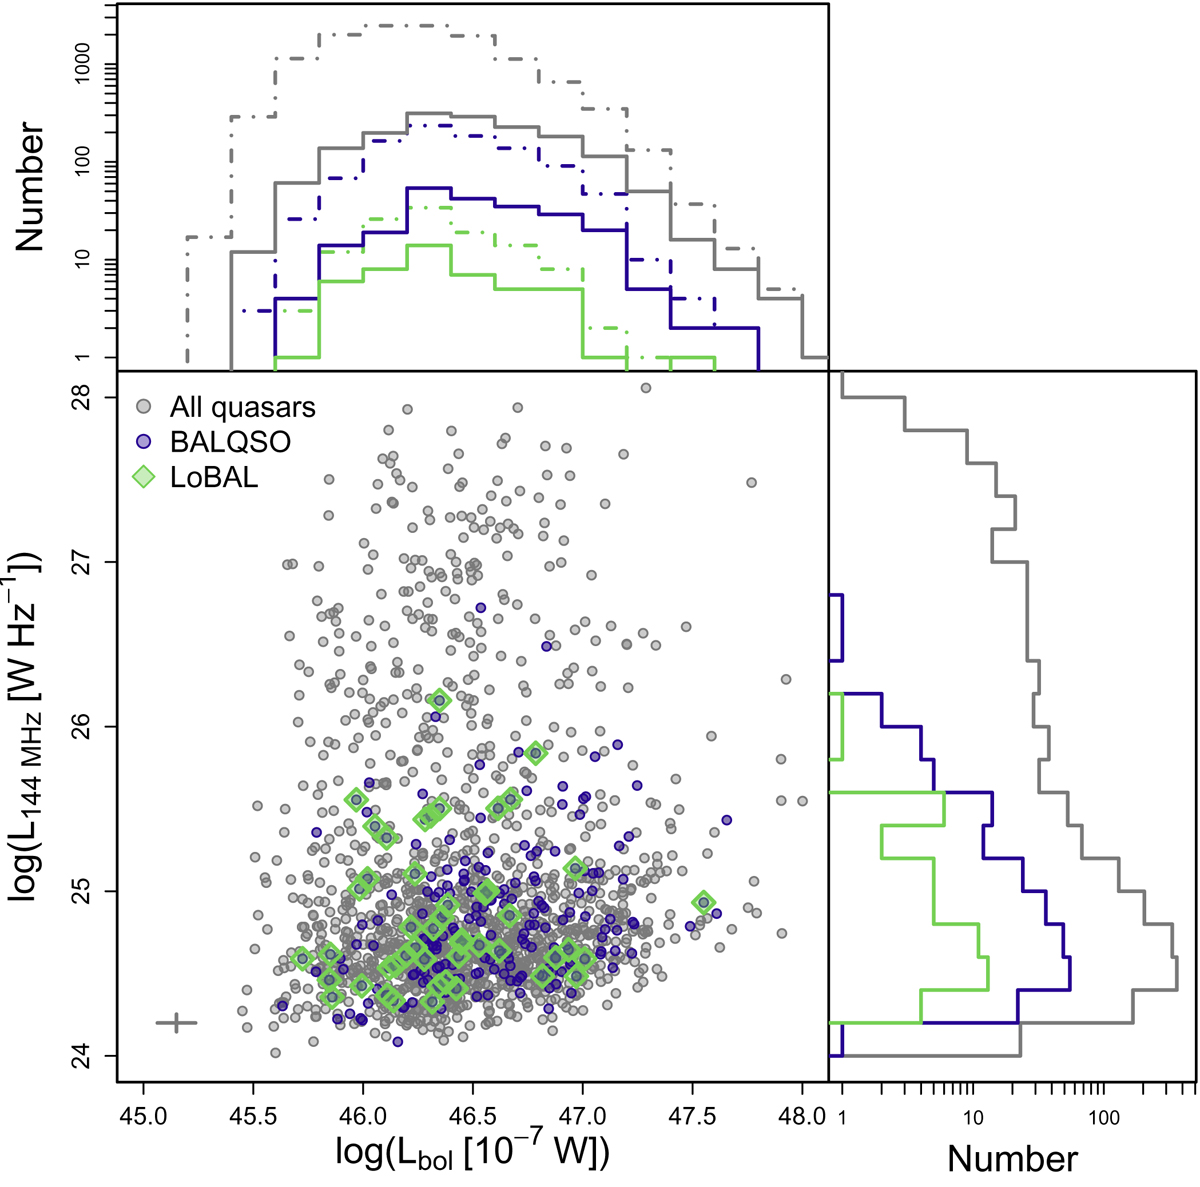
Radio luminosity vs. bolometric luminosity. Light gray points are all quasars with LoTSS detections, and purple points are those classified as BALQSO. The median errors are shown by the cross in the bottom left of the plot. Top panel: distributions of bolometric luminosity: solid lines represent the LoTSS-detected samples, while dot-dashed lines represent all sources regardless of LoTSS-detection. Right panel: distributions of radio luminosity for LoTSS-detected sources. The line colours are the same as in the scatter plot.
Current usage metrics show cumulative count of Article Views (full-text article views including HTML views, PDF and ePub downloads, according to the available data) and Abstracts Views on Vision4Press platform.
Data correspond to usage on the plateform after 2015. The current usage metrics is available 48-96 hours after online publication and is updated daily on week days.
Initial download of the metrics may take a while.