Fig. 10.
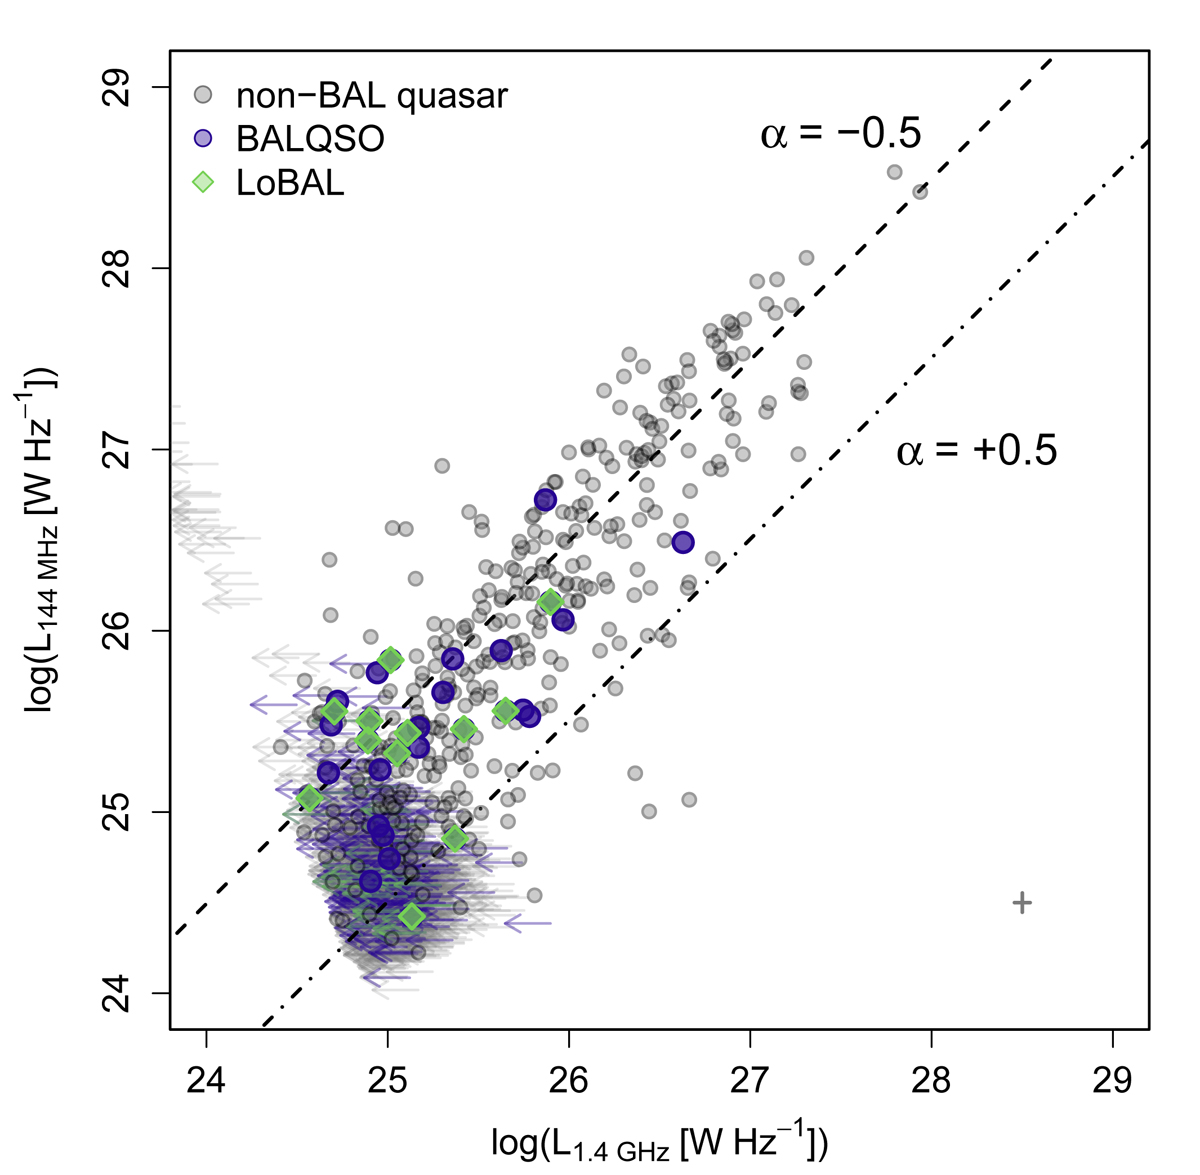
Radio luminosity from LDR1 vs. FIRST measurements. Lines of constant spectral index are drawn on the plot, with the appropriate labels. Upper limits for sources are detected in LDR1 but not FIRST are shown as left-pointing arrows. The median uncertainties for detections (i.e., not upper limits) are shown as a cross in the bottom right corner of the plot.
Current usage metrics show cumulative count of Article Views (full-text article views including HTML views, PDF and ePub downloads, according to the available data) and Abstracts Views on Vision4Press platform.
Data correspond to usage on the plateform after 2015. The current usage metrics is available 48-96 hours after online publication and is updated daily on week days.
Initial download of the metrics may take a while.