Free Access
Fig. 8.
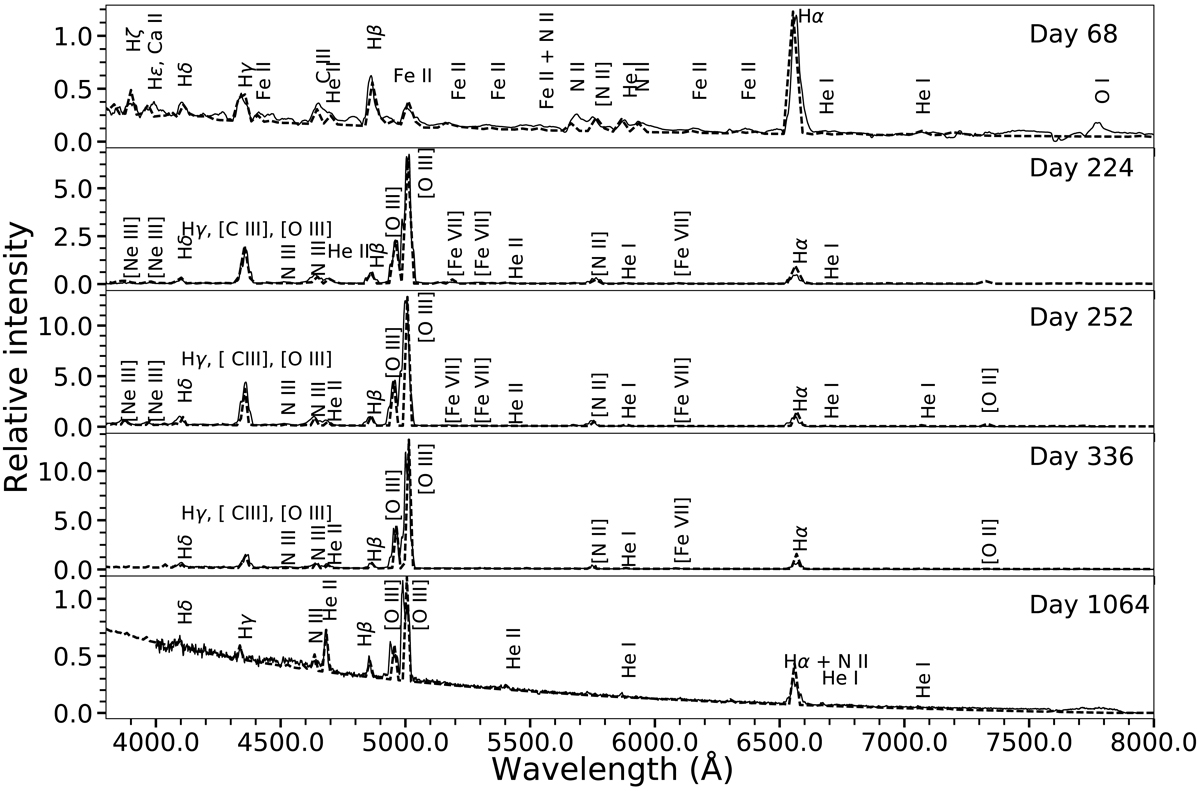
Best-fit CLOUDY model spectra (dashed line) plotted over the observed spectra (continuous line) of T Pyx obtained on day 68, 224, 252, 336, and 1064. The spectra are normalized to Hβ. The identified lines and time since discovery in days (numbers to the right) are marked.
Current usage metrics show cumulative count of Article Views (full-text article views including HTML views, PDF and ePub downloads, according to the available data) and Abstracts Views on Vision4Press platform.
Data correspond to usage on the plateform after 2015. The current usage metrics is available 48-96 hours after online publication and is updated daily on week days.
Initial download of the metrics may take a while.