Free Access
Fig. 6.
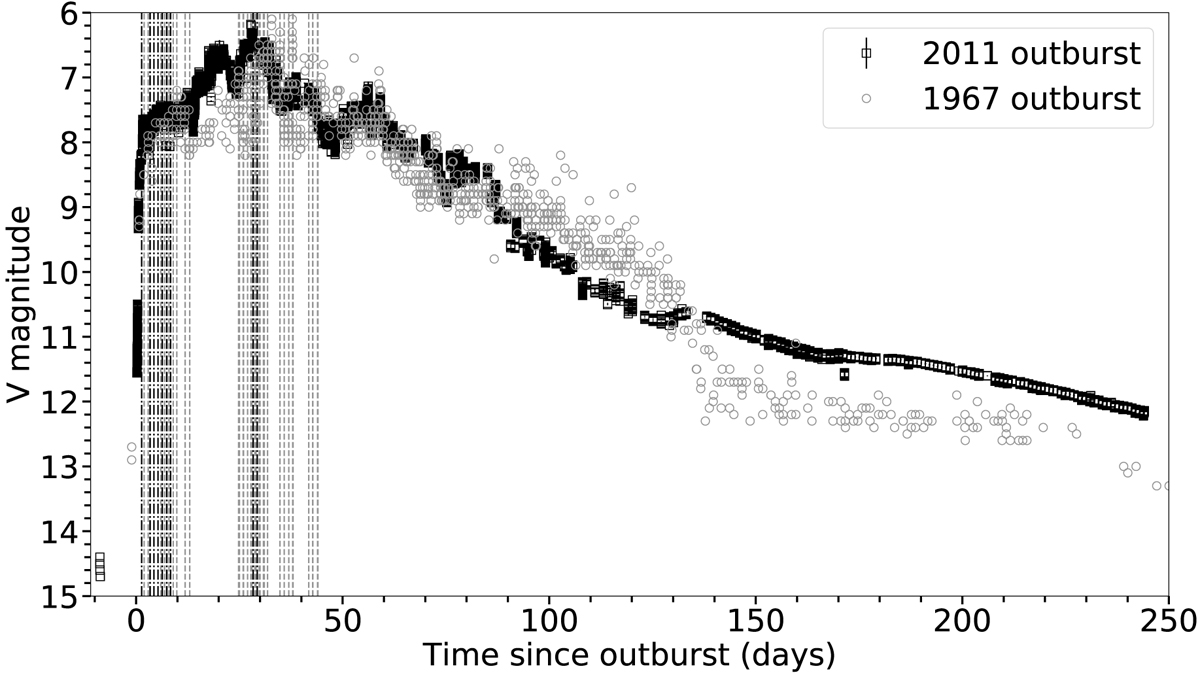
Light curve for T Pyx during its 1967 and 2011 eruptions. The black squares and grey circles correspond to the 2011 and 1967 eruptions, respectively. The black and grey dashed lines correspond to the polarization epochs during the 2011 and 1967 eruptions, respectively.
Current usage metrics show cumulative count of Article Views (full-text article views including HTML views, PDF and ePub downloads, according to the available data) and Abstracts Views on Vision4Press platform.
Data correspond to usage on the plateform after 2015. The current usage metrics is available 48-96 hours after online publication and is updated daily on week days.
Initial download of the metrics may take a while.