Fig. 2.
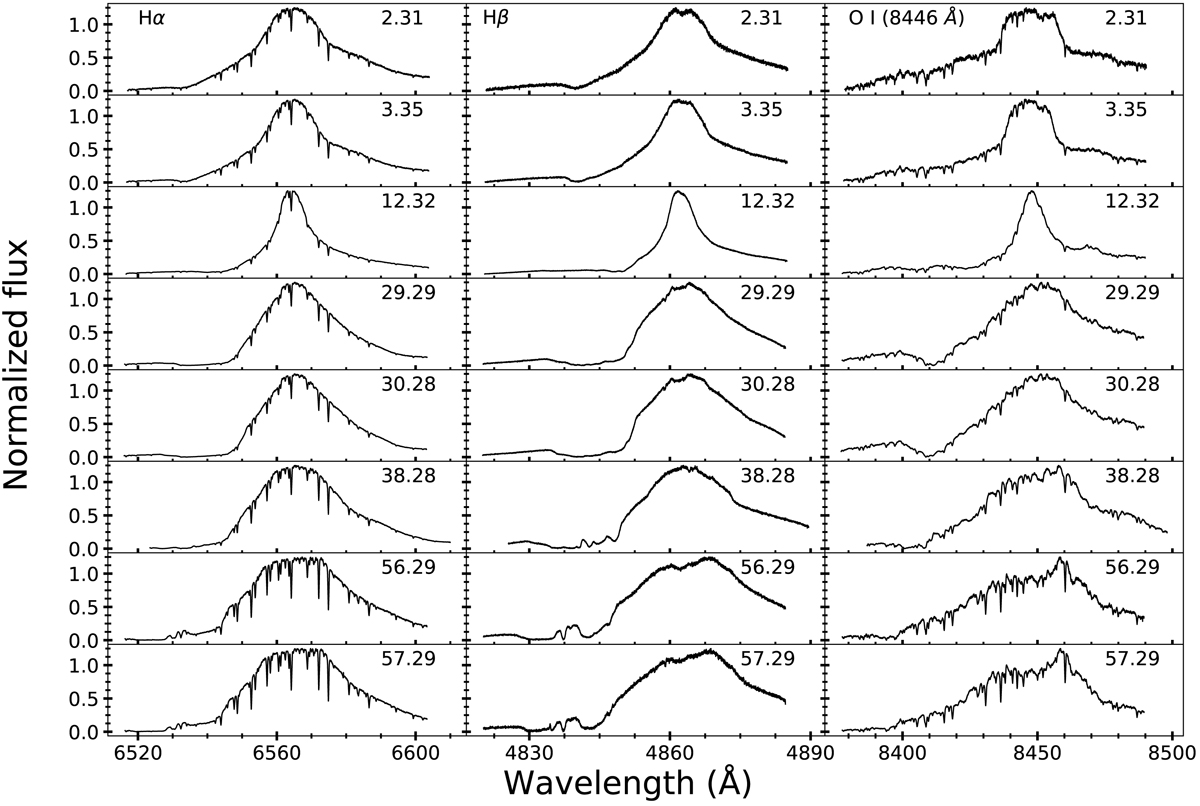
High resolution spectral (R = 27 000) evolution of T Pyx from 2011 April 16 to 2011 June 10. Evolution of Hα, Hβ, and O I (8446 Å) line profiles are shown. We note the variation in the velocity of the lines as the system evolves. There is a decrease in velocity from day 2.31 to 12.32 and then an increase up to ∼2000 km s−1 until day 57.29.
Current usage metrics show cumulative count of Article Views (full-text article views including HTML views, PDF and ePub downloads, according to the available data) and Abstracts Views on Vision4Press platform.
Data correspond to usage on the plateform after 2015. The current usage metrics is available 48-96 hours after online publication and is updated daily on week days.
Initial download of the metrics may take a while.