Fig. 10.
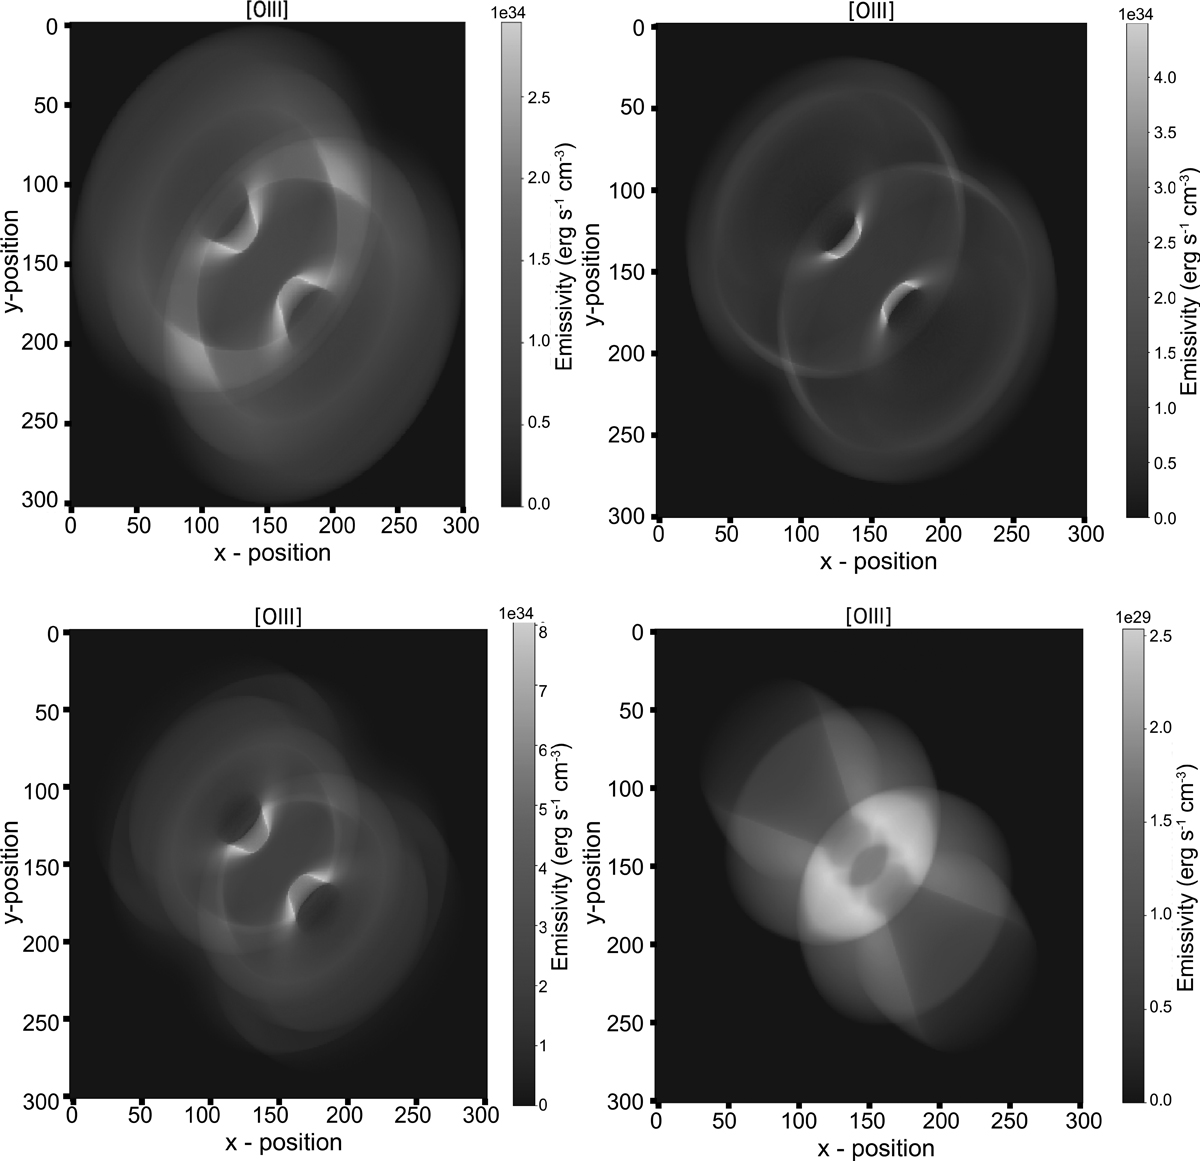
Evolution of [O III] (4959 and 5007 Å lines) on day 224 (top left panel), 252 (top right panel), 336 (bottom left panel), and 1064 (bottom right panel). We note the increase in intensity from day 224 to day 336 and then the drop in intensity on day 1064. Here, one unit of x and y position corresponds to x224 = 6.3 × 1012 cm, x252 = 1.41 × 1013 cm, x336 = 2.09 × 1013 cm, and x1064 = 3.31 × 1011 cm.
Current usage metrics show cumulative count of Article Views (full-text article views including HTML views, PDF and ePub downloads, according to the available data) and Abstracts Views on Vision4Press platform.
Data correspond to usage on the plateform after 2015. The current usage metrics is available 48-96 hours after online publication and is updated daily on week days.
Initial download of the metrics may take a while.