Fig. 1.
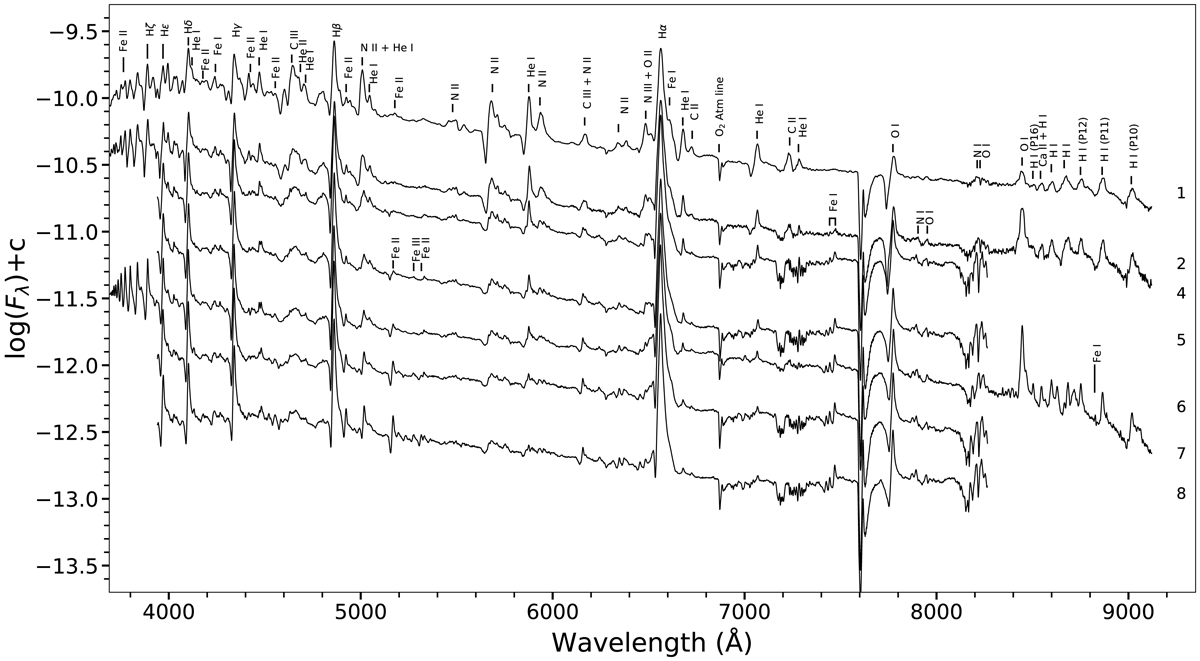
Low resolution optical spectral evolution of optically thick phase of T Pyx from 2011 April 15 to 2011 April 22. The spectra are dominated by P Cygni profiles. The identified lines and time since discovery in days (numbers to the right) are marked. The P Cygni absorption components become sharper and deeper as the system evolves.
Current usage metrics show cumulative count of Article Views (full-text article views including HTML views, PDF and ePub downloads, according to the available data) and Abstracts Views on Vision4Press platform.
Data correspond to usage on the plateform after 2015. The current usage metrics is available 48-96 hours after online publication and is updated daily on week days.
Initial download of the metrics may take a while.