Open Access
Fig. 8.
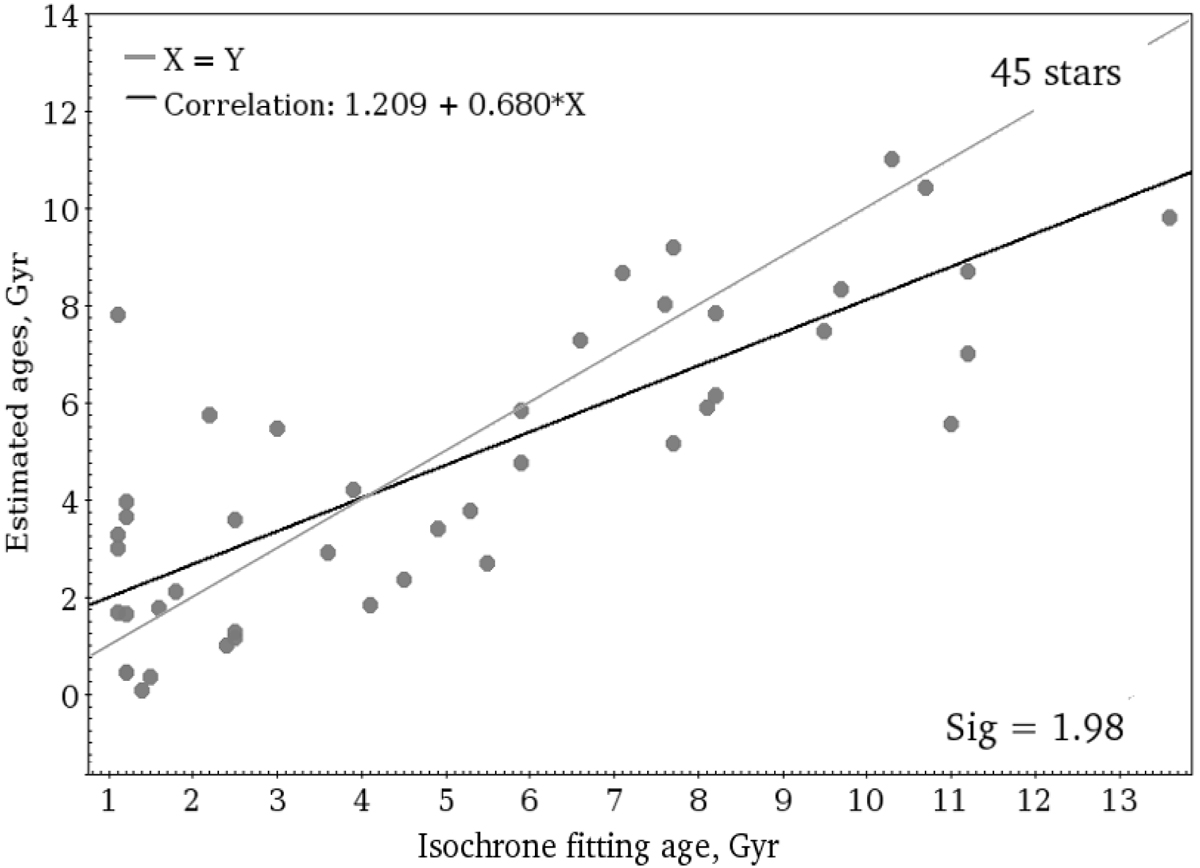
Comparison of stellar ages derived from the [Y/Mg] ratio with isochrone fitting ages for a sample of stars not used to infer the [Y/Mg]–age relation. The thick line represents the final correlation; the thin grey line is a diagonal.
Current usage metrics show cumulative count of Article Views (full-text article views including HTML views, PDF and ePub downloads, according to the available data) and Abstracts Views on Vision4Press platform.
Data correspond to usage on the plateform after 2015. The current usage metrics is available 48-96 hours after online publication and is updated daily on week days.
Initial download of the metrics may take a while.