Fig. 5.
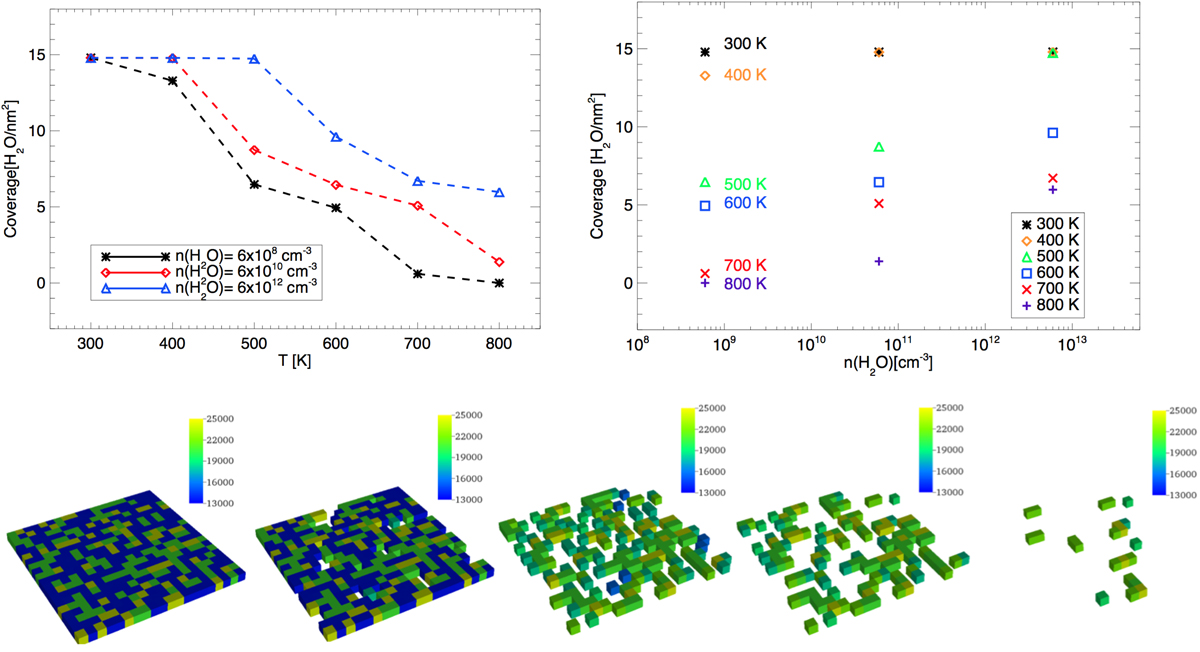
Top panel: surface coverage (H2O nm−2) as a function of temperature (K) (left panel) and water vapor density (cm−3) (right panel). Each data point is the average ±σ of the coverage values at equilibrium (see Fig. 4). Left panel: dashed lines are used here to link each point and emphasize the step-like decrease in the surface coverage with temperature. Bottom panel: simulated [1 0 0] forsterite surface grids at 6 × 108 cm−3 and T = [300 − 700] K (from left to right panels). The color scale indicates the adsorption energy of the occupied sites in the range between 13 000 K (blue) and 25 000 K (yellow).
Current usage metrics show cumulative count of Article Views (full-text article views including HTML views, PDF and ePub downloads, according to the available data) and Abstracts Views on Vision4Press platform.
Data correspond to usage on the plateform after 2015. The current usage metrics is available 48-96 hours after online publication and is updated daily on week days.
Initial download of the metrics may take a while.