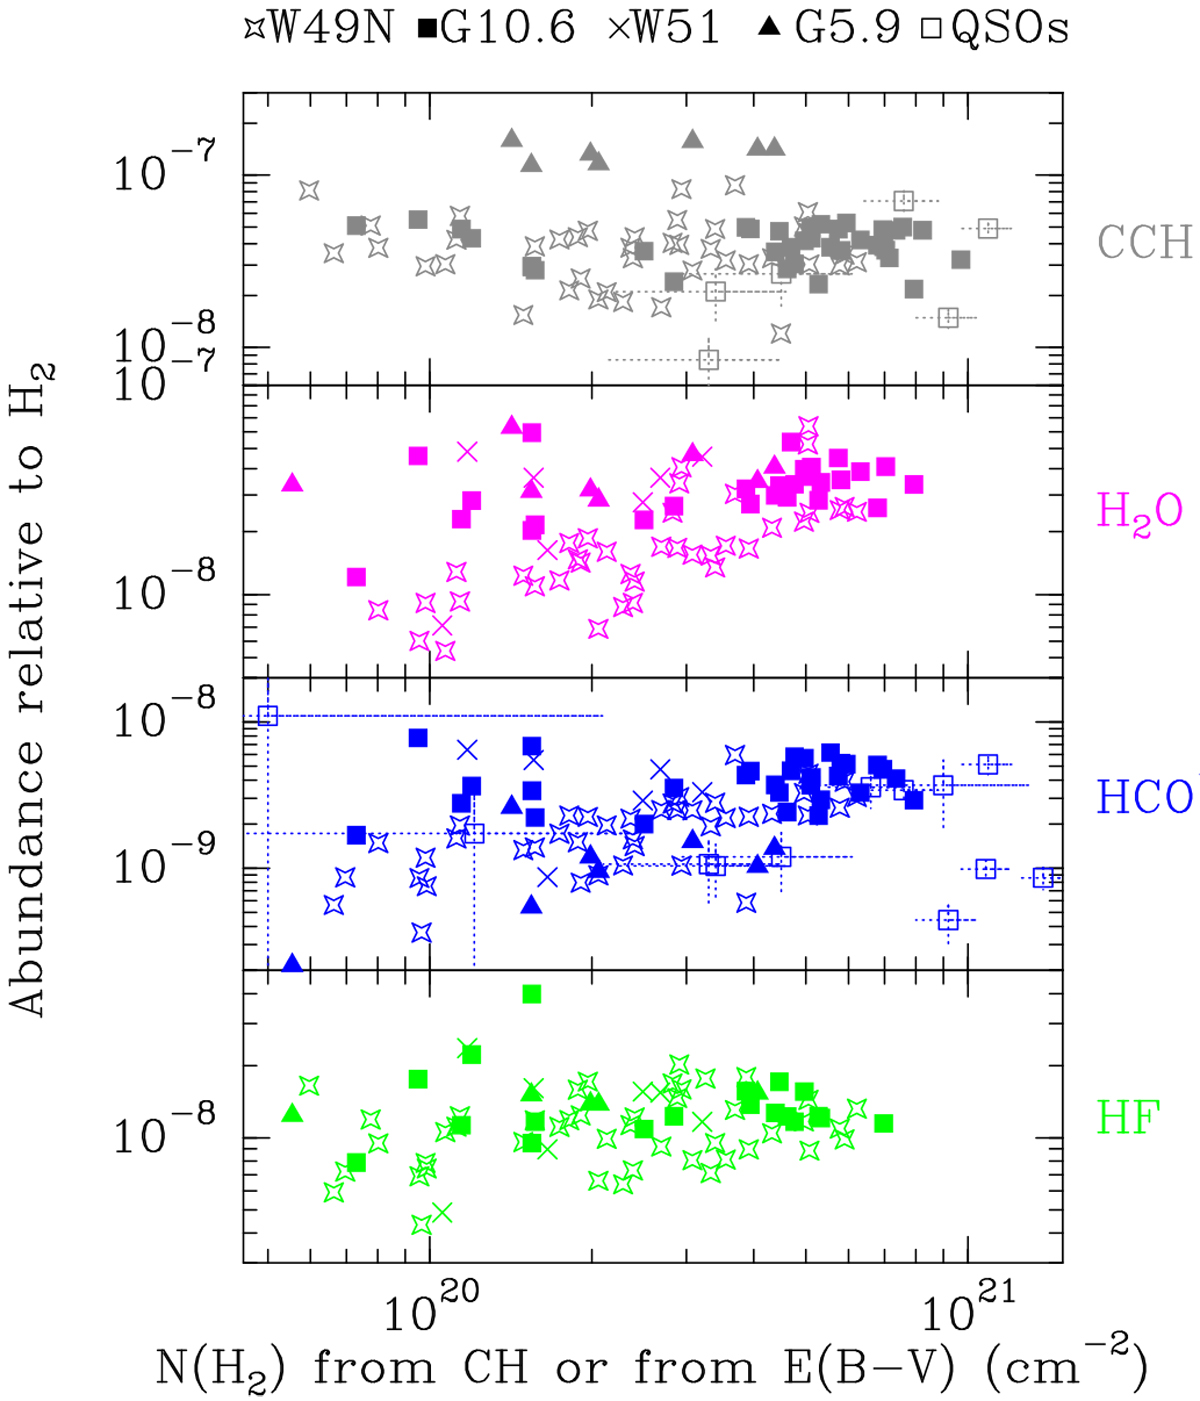
Fig. 4

Abundance relative to H2 as a functionof the H2 column density derived from the submillimeter CH observations at 532 or 536 GHz or from the reddening. The different symbols refer to different sight-lines as noted at top. HCO+ is shown in blue, HF in green, H2O in purple, and CCH in gray. The CCH data were taken with the IRAM-30 m telescope (Gerin et al. 2011) as well as the HCO+ data for W49N and W51 (Godard et al. 2010).
Current usage metrics show cumulative count of Article Views (full-text article views including HTML views, PDF and ePub downloads, according to the available data) and Abstracts Views on Vision4Press platform.
Data correspond to usage on the plateform after 2015. The current usage metrics is available 48-96 hours after online publication and is updated daily on week days.
Initial download of the metrics may take a while.


