Fig. 7.
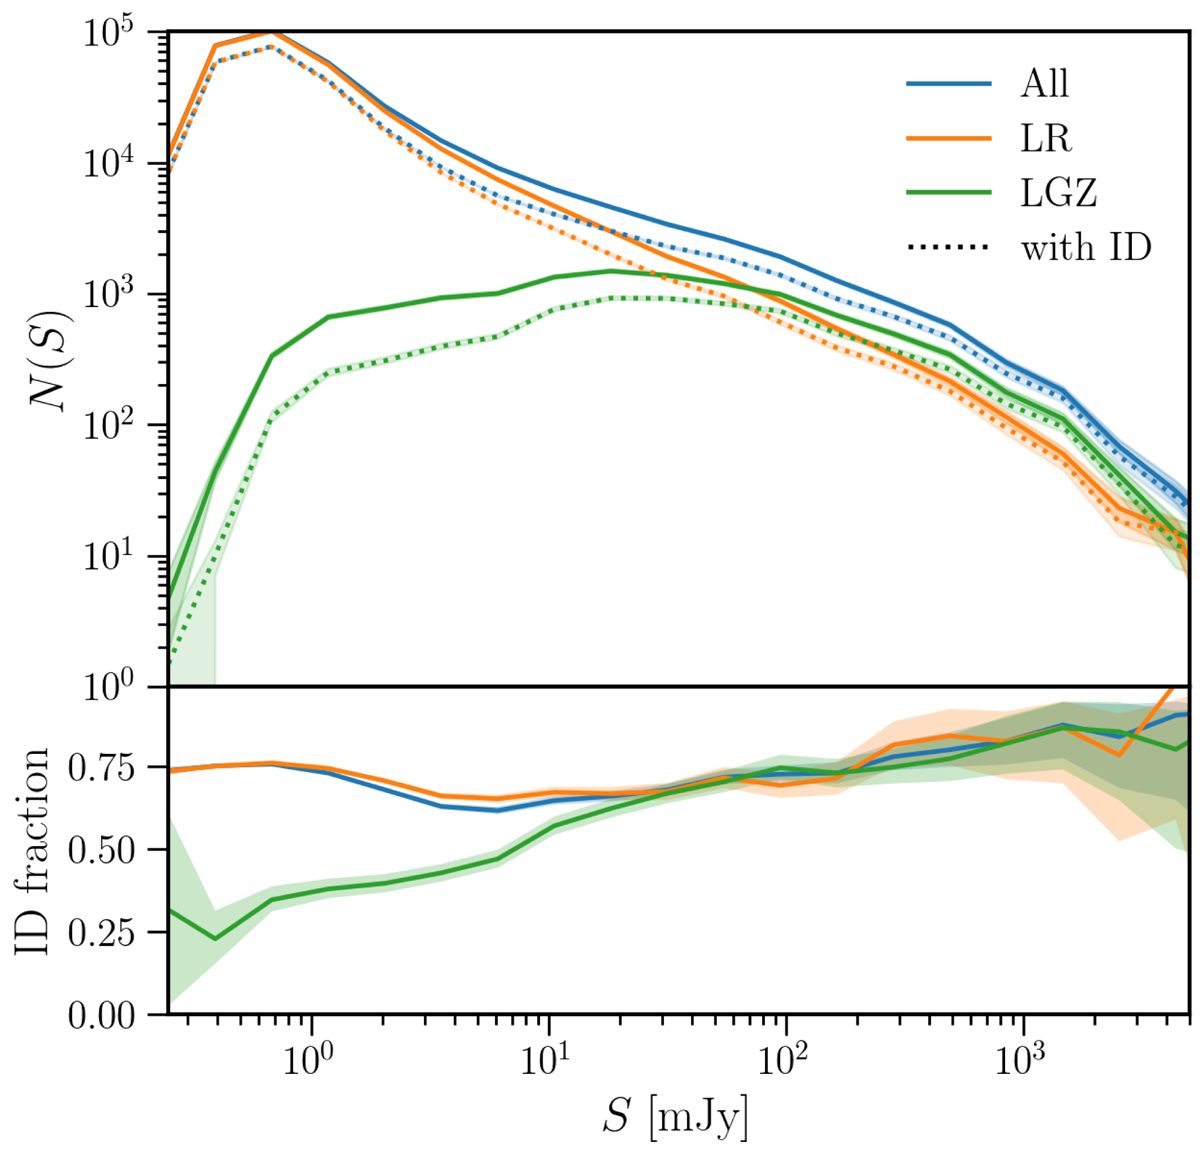
Total number of sources (solid lines) and number of sources with identifications (dotted lines) as a function of 150-MHz flux density, in bins of 0.23 dex, for all sources (blue) and via the two major methods: LGZ (green) and LR (orange). The respective fractions of identifications (i.e. the ratio of the number of sources with identifications in each category to the number of sources in each category) as a function of flux density are shown in the bottom panel. Filled regions show the errors that are estimated using Monte Carlo simulations drawn from Poissonian distributions.
Current usage metrics show cumulative count of Article Views (full-text article views including HTML views, PDF and ePub downloads, according to the available data) and Abstracts Views on Vision4Press platform.
Data correspond to usage on the plateform after 2015. The current usage metrics is available 48-96 hours after online publication and is updated daily on week days.
Initial download of the metrics may take a while.