Fig. 3.
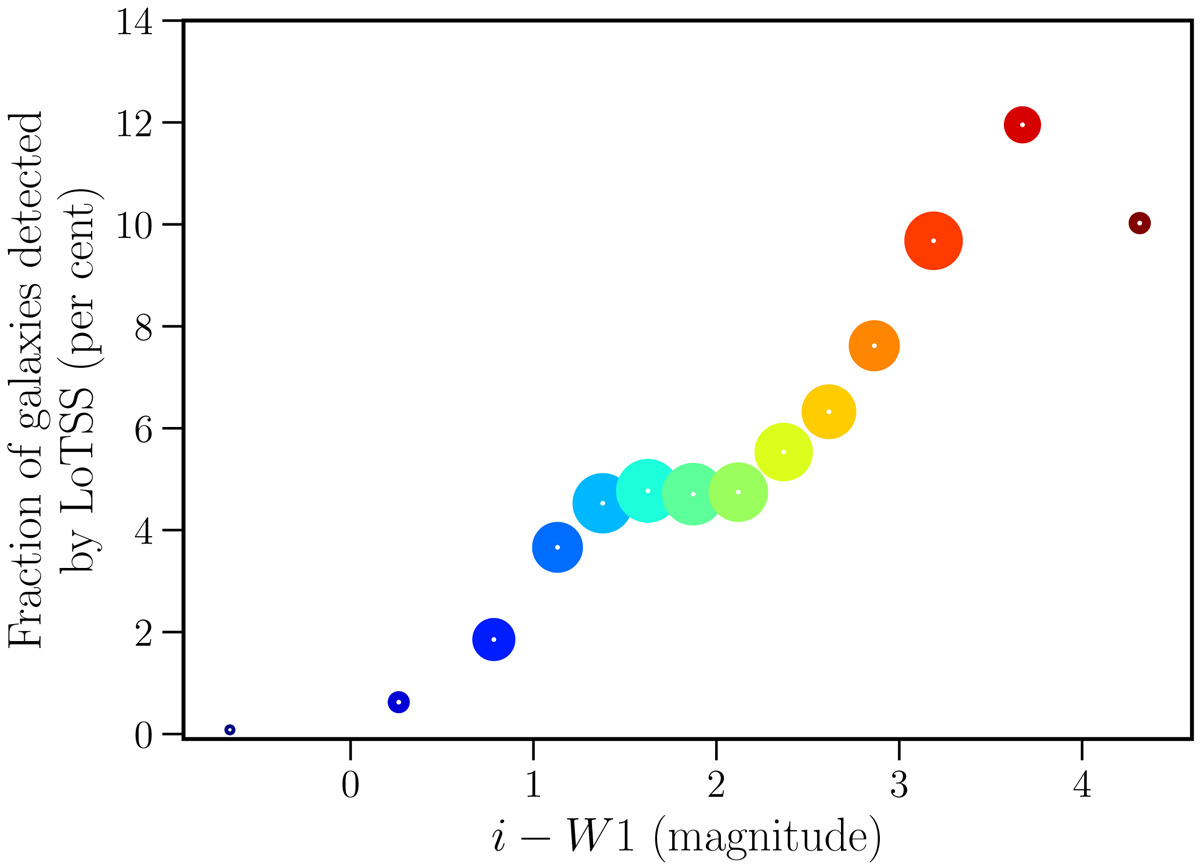
Fraction of all galaxies within a particular colour bin that have a LoTSS counterpart down to the flux density limit of LoTSS. The colour of the symbols corresponds with the colour used in Fig. 1. The position along the x-axis is given by the average colour of all the sources in each bin. Poisson error is negligible and the error is dominated by misclassification and incompleteness. The size of the marker is proportional to the number of LoTSS sources matched. This plot demonstrates the additional power of using colour in the LR analysis owing to the much higher probability for red (i − W1 > 3) galaxies to host a radio source than for blue (i − W1 < 2) galaxies to do so.
Current usage metrics show cumulative count of Article Views (full-text article views including HTML views, PDF and ePub downloads, according to the available data) and Abstracts Views on Vision4Press platform.
Data correspond to usage on the plateform after 2015. The current usage metrics is available 48-96 hours after online publication and is updated daily on week days.
Initial download of the metrics may take a while.