Fig. 1.
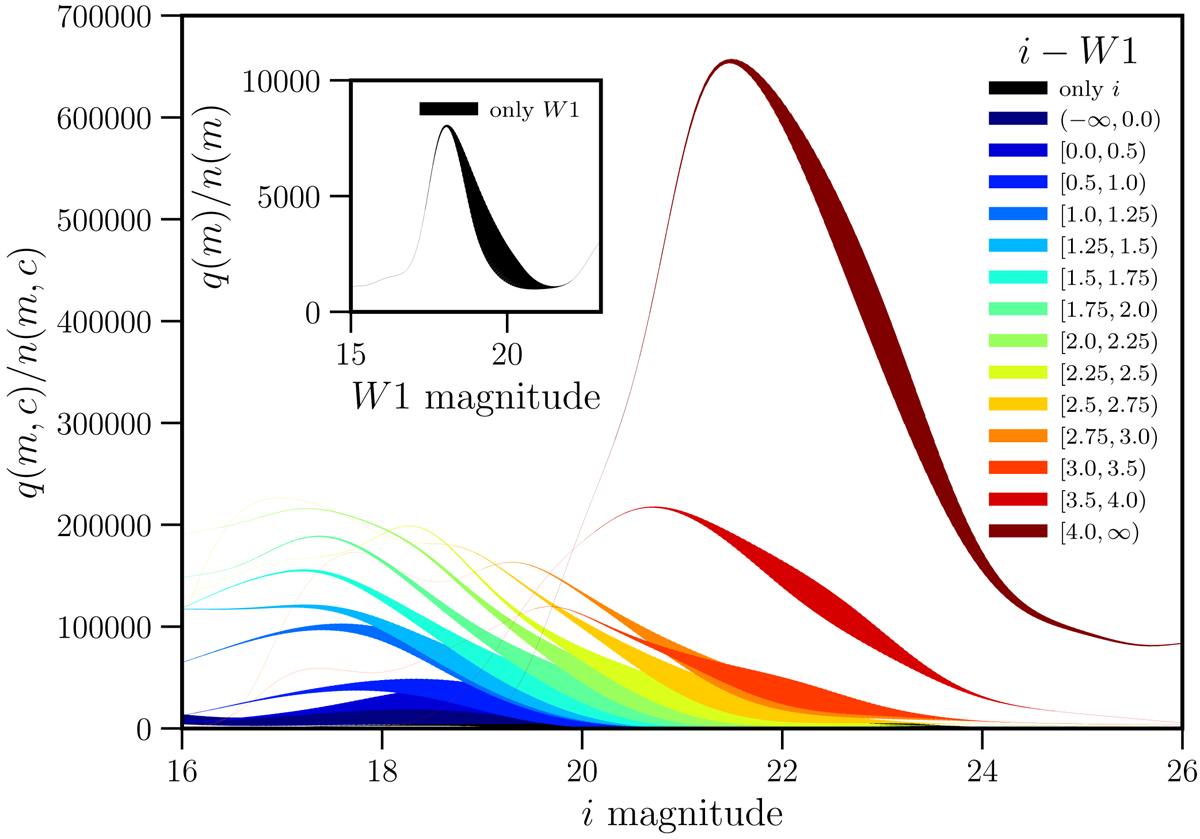
Plots of q(m, c)/n(m, c) for each colour bin of the LR analysis. Lines are colour-coded by galaxy colour bin (running naturally from blue to red); the width of the line is proportional to the number of LoTSS matches at that magnitude, i.e. thicker regions represent the most important regions for q(m, c)/n(m, c) to be determined. The figure clearly demonstrates that the KDE approach for calculating q(m, c) and n(m, c) is able to produce broadly smooth versions of these functions with sufficient magnitude resolution. At fainter magnitudes, the ratio q(m, c)/n(m, c) can be seen to rise monotonically and strongly towards redder colour bins, i.e. redder galaxies have a higher probability to host a radio source, as expected, except at the very brightest magnitudes where nearby star-forming (blue) galaxies contribute significantly.
Current usage metrics show cumulative count of Article Views (full-text article views including HTML views, PDF and ePub downloads, according to the available data) and Abstracts Views on Vision4Press platform.
Data correspond to usage on the plateform after 2015. The current usage metrics is available 48-96 hours after online publication and is updated daily on week days.
Initial download of the metrics may take a while.